4.3 Food and Nutrition Security
Food Intake
4.3.94 The data from NSSO 43 and 49/50 rounds indicate that both in urban and rural population there has been a small reduction in cereal and pulse consumption and an increase in milk and edible oil consumption (Table-4.3.3)
Table-4.3.3
Time
trends in consumption of food stuffs
(Consumption per person in kgs/month)
|
RURAL |
URBAN |
||||
| 1987-88 |
1993-94 |
1993-94 |
|||
| Cereals |
14.40 |
13.40 |
11.20 |
10.60 |
|
| Pulses |
0.25 |
0.24 |
0.34 |
0.33 |
|
| Edible oil |
0.33 |
0.37 |
0.54 |
0.56 |
|
| Milk |
3.20 |
3.94 |
4.26 |
4.89 |
|
 4.3.95
Data from the National Nutrition Monitoring Bureau (NNMB) which has been
monitoring food intake and nutritional status in ten States since 1973
also showed that there has been small but progressive reduction in intake
of cereal, millets and pulses, over the last two decades (Fig.3);
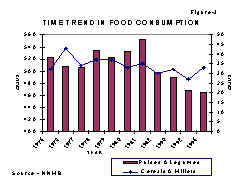
4.3.95
Data from the National Nutrition Monitoring Bureau (NNMB) which has been
monitoring food intake and nutritional status in ten States since 1973
also showed that there has been small but progressive reduction in intake
of cereal, millets and pulses, over the last two decades (Fig.3);  vegetable
consump-tion remained un-altered (Fig.4). In addition the NNMB data showed
that at the overall National level: (1) household intake of cereals and
millets remained above or at the level of RDA (2) Pulses and legumes have
been marginally below the RDA (3) Green leafy vegetables (major inexpensive
source of vitamins and minerals) consumption has been only one-third of
RDA (4) Overall vegetable intake has been marginally below the RDA and
has remained essentially unaltered (Fig 3 and 4).
vegetable
consump-tion remained un-altered (Fig.4). In addition the NNMB data showed
that at the overall National level: (1) household intake of cereals and
millets remained above or at the level of RDA (2) Pulses and legumes have
been marginally below the RDA (3) Green leafy vegetables (major inexpensive
source of vitamins and minerals) consumption has been only one-third of
RDA (4) Overall vegetable intake has been marginally below the RDA and
has remained essentially unaltered (Fig 3 and 4).
4.3.96 Data from NNMB indicates that there are differences in the consumption
of foodstuffs between urban and rural areas. There is relatively lower
consumption of cereals and millets in urban area. Green leafy vegetables
consumption is very low both in urban and rural areas (Fig.5). In view
of the fact that milder forms of micronutrient deficiencies are widespread
in urban and rural areas, it is imperative that steps are taken to improve
availability of green leafy vegetables. There are substantial differences
in the type of foodstuffs consumed between income groups in urban areas.
Cereals and millets constitute more than 50% of the total food among the
low income group (LIG), industrial labour and slum dwellers, while for
the high income group (HIG) and middle income group (MIG), these food
groups form about one-fourth and one third of the total food, respectively.
4.3.97 Cereal intake is lowest among the HIG and shows a decreasing trend with better economic status (Fig 6). On the other hand, income status bears a positive relation with consumption of pulses, milk, fruits, flesh food, oil and sugar. Among these foods, milk tended to show sharp differentials between the income groups. Analysis of data collected by Food and Nutrition Board and NNMB shows that there are large differences in cereal and pulse consumption between states (Fig.7a and 7b). The intake of cereals varies from 369g/CU in Kerala to about 628g/CU in Orissa. In Kerala and Tamil Nadu, the mean intake is below 460g/CU but in majority of states the intake is around 460g/CU (recommended intake-ICMR).
4.3.98 The recommended intake of pulses is 40g per day. Only in Karnataka, Madhya Pradesh, Rajasthan and Uttar Pradesh is the mean intake above this level (Figure – 7b). In other words, a larger percentage of the population consumes an inadequate level of pulses as compared to cereals. This observation is in line with the per-capita availability of these foodstuffs. Unless appropriate steps are taken to substantially augument the production of pulses in the country, the quality of dietaries may further deteriorate.
Intake of Nutrients
4.3.99 The major source of information on nutrient intake covering more than one state and over the last two decades is the NNMB. Figures 8a and 8b indicate time trends in energy and protein intake over the last two decades. There has been a slight decline in energy and protein intake over the years but average national intake for protein and energy remained at or near RDA.
4.3.100 In contrast Vitamin A intakes has remained far below the RDA (Figure – 9b). It is however noteworthy that there has been decline in both the severe and milder clinical manifestation of vitamin A deficiency over the last two decades. Iron intake has shown a marginal decline over time (Figure - 9a). Because of the poor bioavailability from Indian diets, the iron availability has remained suboptimal and anaemia continues to remain a public health problem.
4.3.101 The mean energy intake varies from 2,206 kcal in the lowest income group to about 2,600 kcal in the highest. The two lowest income categories show a difference of 150 kcal in intake, but those with incomes between Rs. 30 and Rs. 90/capita/month show a similar intake. Only families belonging to the highest income group have an average calorie intake above the RDA of 2,400 (Fig.10). In rural area the average protein intake varies 53g/cu in the lowest income group with less than Rs.30 per capita per month, to 70g/cu among those with Rs.300 and more. However, the average intake is close to the RDI of 60g only in the top three income categories.
4.3.102 Energy intake among major rural group of cultivators, landless agricultural labourers, non-agricultural labourers and others is shown in Fig.11a. Except in the cultivators group where intake is close to RDA of 2400, in all other groups the level is below RDA.

4.3.103 Among urban population groups differences in calorie consumption are far more obvious. Females in slums consume 2000 Kcal as against 2600 Kcal consumed by those belonging to HIG. Average intake of MIG is just around RDA of 2400 Kcal while the LIG and IL groups show a deficit of about 160 Kcal per CU (Fig.11b). Urban families belonging to lower income group consume even lower energy than rural families.
4.3.104 Energy consumption in labourers (urban and rural low-income groups) is low; persons performing manual labour require higher energy intake to meet their energy needs. Poor environmental sanitation and lack of safe drinking water renders them more prone for infections. As a result of this dual insult, chronic energy deficiency continues to be a problem in this segment of the population.
Interstate differences
4.3.105 Data from the NSSO and NNMB show that there are substantial interstate differences in food consumption, energy, protein and vitamin intake (Fig.7, 12,13,14). Nutrient intake in each State was higher in urban as compared to rural population.
4.3.106 Data on nutrient intake among tribals is shown in Fig.15a, b, c and d. It is obvious that the tribals in different States have different level of nutrient intakes. In most States, the intake of most of the nutrients was lower among tribals than the non-tribal rural population.
4.3.107 Available data from National Family Health survey on percentage of severely undernourished children in these States are shown in Fig.16.
It is obvious that there are substantial differences in the nutritional status of children between the states, especially in the prevalence of moderate and severe chronic energy deficiency in under five children. Kerala has the lowest energy and protein consumption and also the lowest prevalence of severe undernutrition. Madhya Pradesh and Orissa have relatively higher energy intakes but have higher prevalence of severe CED.
4.3.108 Statewise data regarding prevalence of severe CED and under five mortality is shown in Fig.17. In States with higher prevalence of severe undernutrition also have higher under five mortality data (Fig.17). Ample data exists to show that undernutrition increases susceptibility to infection and infection aggravates undernutrition. This vicious cycle, if allowed to continue ends in death. Ready access and utilisation of health care in Kerala which cuts the vicious cycle of undernutrition and infection might be the most important factor accounting for low undernutrition rates in Kerala. It is therefore imperative that health and nutrition programmes are co-ordinated to achieve optimal synergy between the two interventions so that there is improvement in nutritional and health status.


Intrafamilial distribution of food
4.3.109 It is widely believed that in India especially among rural poor food distribution is not based on the `need'; the bread winner gets sufficient food, the children the next share and the remains taken by the women. In times of scarcity dietary intake of women and children are likely to be most adversely affected. Several small studies in different States have reported that intrafamilial distribution of food follows this traditional pattern even today. However, this may not be applicable to all States and all strata of society. Analysis of data from diet survey by 24 hours dietary recall method carried out by NNMB in 1975-80 given in (Fig.18). This data shows that in 31% of households energy consumption was adequate in all members of the family. In 19% of households energy consumption was inadequate for all members of the family. It is noteworthy that in 25% of households energy intake was adequate among adults but not among the pre-school children (Fig.18). Maternal education (high school and above) enabled the mothers to achieve a better intrafamilial distribution of food (Table 4.3.4).
Table-4.3.4
Percentage distribution of calorie adequacy status and female literacy
|
Energy Status of |
Female literacy status |
||||
|
Adult |
Pre-school children |
Illiterate |
Primary+ Secondary |
High school and above |
|
|
Male |
Female |
||||
|
+ |
+ |
+ |
29.6 |
35.6 |
54.1 |
|
+ |
+ |
- |
27.8 |
21.2 |
17.0 |
|
- |
- |
- |
18.9 |
18.7 |
11.9 |
|
Others |
23.7 |
24.5 |
17.0 |
||
+ Indicates adequacy, - Indicates inadequacy; Sample size - 1956
The importance of nutrition education through all channels of communication regarding appropriate infant and child feeding practices are of paramount importance in ensuring that the preschool children especially the children from age groups 6-24 months get adequate food from the family pot; care and time spent on feeding the young child can pay rich dividends in term of sharp reduction in undernutrition in this age group
4.3.110 Diet surveys carried out in urban and rural areas among poorer segments of the population indicate that dietary intake remains unaltered in women irrespective of physiological status; the extra needs of pregnancy and lactation are usually not met. Nutrition education to all the family members is required to ensure that pregnant and lactating women do eat 1/5th or 1/6th more than their habitual diet. This is a critical input in the efforts to reduce low birth weight and give the child a good start at birth.
Assessment of Nutritional Status
4.3.111 Collecting data on food intake and computing of nutrient intake of household and individual level are difficult and time consuming. These data, do give some idea about `at risk' states, sub segments of population such as tribal, households or vulnerable groups within households; however, these parameters cannot accurately indicate nutritional status of the individual or identify persons suffering from nutritional deficiencies. Anthropometric indices (Height, Weight, midarm circumference etc.), haemoglobin estimation and clinical signs of nutritional deficiencies provide accurate and reliable information on nutritional status of the individual. These parameters are used in clinical practice for screening and detection of persons suffering from nutritional deficiencies. These are also useful indices for assessment of nutritional status at community level and have been widely used in monitoring of nutritional status both of individuals and of communities. Body mass index (weight in kg/height in cm2) is the most widely used index for assessment of nutritional status of adults. In children weight for height (wasting), weight for age (underweight) height for age (stunting) are used for assessing nutritional status. The NNMB has been the major source of data on nutritional status of the population in ten Southern and Western States. In '92-93 the National Family Health Survey (NFHS) had collected information on nutritional status in children in all States.
Nutritional Status of Adults
4.3.112 Indian men and women are shorter and lighter than their developed country counter parts. Persons with BMI value less than 18.5 are considered to suffer from chronic energy deficiency (CED). The CED group is further classified into different degrees: first (17 to 18.5), second (16 to 17) and third (below 16). NNMB data on rural population in ten states showed that the average BMI values were similar for both males and females. Only half the adults had normal nutritional status while the rest suffered from different degrees of CED. CED grade II and III are associated with lowering of work capacity. A positive shift in the distribution of BMI values, noted during the 1970s and 1980s, is suggestive of an improvement in nutritional status of rural adults. Data from NNMB repeat survey in 1996-97 confirms that there has been small reduction in severe grades of CED; there is a small but significant increase in obesity both in men and women (Fig.19). Thus, the country has to gear up to face the health problems of both undernutrition and obesity in future.

4.3.113 NNMB does not have data from Northern and Eastern states. During the Ninth Plan efforts will be made to collect data on nutritional status from these states many of which have high morbidity, fertility, low literacy so that appropriate interventions can be planned and implemented.
4.3.114 Ninth Plan operational strategy to improve the dietary intake of the family and improve nutritional status of the adults includes:
- Adequate agricultural production of cereals, pulses, vegetables and other food stuffs needed to fully meet the requirement of growing population.
- Improvement in purchasing power through employment generation and employment assurance schemes;
- Providing subsidised food grains through TPDS to the families below poverty line.
Explore feasibility of providing subsidised millets to families Below Poverty Line (BPL) ; use of millets might ensure better self targetting and that the millets do really reach the targetted families; if millets are used, the amount of millets provided could be increased without increasing total cost of food subsidy. Details of these initiatives are dealt with in the respective chapters.
Nutritional status of vulnerable groups
Pregnant and lactating women
4.3.115 Traditional belief is that pregnant and lactating women require additional dietary intake to meet their own nutritional requirements and also supply nutrients to the growing foetus and the infants; low dietary intake especially in already chronically undernourished women will have adverse effects on health and nutritional status of both the mother and her offspring.
4.3.116 Studies undertaken during the eighties have shown that in pregnancy :
- Basal metabolic rate is reduced during the second and third trimester of pregnancy.
- There is a reduction in the physical activity
- There might be some increase in the as yet unmeasured "efficiency of energy utilisation".
The saving in nutrients due to all these might to be sufficient to meet the increased requirements of the growing fetus and physiological changes during pregnancy in well nourished women. In habitually well nourished women, optimum weight gain during pregnancy and good obstetric outcome can be achieved over a wide range of habitual dietary intake. In these well nourished women additional dietary intake in pregnancy and lactation may in fact lead to obesity.
4.3.117 In sharp contrast, in chronically undernourished and overworked women, continued low dietary intake during pregnancy might pose a serious threat to the welfare of the mother and the fetus in utero. Part of the observed association between poor maternal nutrition and poor obstetric outcome is also attributable to the higher prevalence of maternal risk factors during pregnancy and poor antenatal care.
4.3.118 Small scale research studies had shown that food supplements improve maternal nutrition and birth weights in poorer segments of population. Encouraged by such data, almost all developing countries have embarked on food supplementation programmes for pregnant and lactating women. Very few of these programmes have been evaluated for the impact of food supplements on birth weight. Available data, however, suggest that the impact, if any, is very limited. One of the major problems in food supplementation programmes is that even when the logistics of reaching the food to women have been meticulously worked out and efficiently carried out, food sharing within the family of the recipient results in the `target' women not getting the supplements in significant quantities. Obviously this might be an important factor responsible for the demonstrated lack of beneficial effect. The lack of adequate antenatal care and continued physical work during pregnancy are two other factors responsible for lack of impact.
4.3.119 Research studies in India and elsewhere have shown that combining adequate antenatal care with effective food supplementation and some reduction in physical activity results in marked improvement in outcome of pregnancy, reduction in low birth weight and neonatal mortality. Operationalisation and implementation of this approach through inter-sectoral co-ordination under existing conditions need be taken up and evaluated. During the next decade there will be progressive increase in the economic constraints; in view of their high cost and limited impact it might not be possible to sustain the food supplementation programmes for all pregnant women in the country. Under these circumstances the feasibility of identifying the situations where there might be deterioration in maternal nutritional status and outcome of pregnancy and targeting the food supplementation programme appropriately should be explored. Research studies have shown that there are readily identifiable situations, which result in further deterioration of maternal nutrition and have adverse impact on outcome of pregnancy. Some such situations are:
- reduction in habitual dietary intake (drought, preharvest season)
- increase in work (newly inducted manual laborers)
- combination of both the above (food for work programmes)
- adolescent pregnancy
- pregnancy in a lactating woman
- pregnancy occurring within two years after last delivery
4.3.120 The local health workers as well as the community can readily identify these women requiring additional food. The panchayat or similar local self-govt. institution can then be given the responsibility of organising the efforts to reach the food to these women.
Situations
leading to deterioration of maternal nutrition during pregnancy
Interventions to combat these include:
|
For obvious reasons these women are too busy and cannot spend hours in the anganwadi for receiving the cooked food supplements.
The method to provide food supplementation to these women may vary from place to place and time to time; some may conveniently be provided food at the work site; in other situations provision of subsidised food grain distributed through the Public Distribution System might be the feasible option . In some other situations it might in fact be possible to envisage linkage between antenatal care and free food grains for pregnant and lactating women, in a pattern similar to the one that is envisaged in the mid day meal scheme for primary school children linking provision of the free food grain through PDS to school attendance; the ANM/PHC medical officer certifies that the woman has had antenatal care as required in the previous month and based on this the free food grain from the public distribution system may be provided to the pregnant woman. With the Panchayati Raj and Nagar Palika institutions it might be possible to monitor these programmes at the local level and consequently achieve better coverage. The feasibility, utilisation, cost and impact of such well directed, innovative strategies involving close local monitoring need be assessed.
New born
 4.3.121
Birth weight, an important determinant of child survival and growth, is
influenced by the nutritional and health status of the mother. Available
data indicate that the mean birth weight in India about 2.7 Kg.; nearly
one-third of new-borns weigh less than 2.5 kg. Mortality rates in infants
below 2 kg. are several folds higher and low birth weight is one of the
most important causes of neonatal mortality. There has hardly been any
change in birth weight in the past three decades . A gender difference
has been noted in mean birth weights, female infants tending to be lighter
than male counterparts. The incidence of low birth weight is highest in
low -income groups. There is a good correlation between birth weights
and BMI of mother (Fig 20).
4.3.121
Birth weight, an important determinant of child survival and growth, is
influenced by the nutritional and health status of the mother. Available
data indicate that the mean birth weight in India about 2.7 Kg.; nearly
one-third of new-borns weigh less than 2.5 kg. Mortality rates in infants
below 2 kg. are several folds higher and low birth weight is one of the
most important causes of neonatal mortality. There has hardly been any
change in birth weight in the past three decades . A gender difference
has been noted in mean birth weights, female infants tending to be lighter
than male counterparts. The incidence of low birth weight is highest in
low -income groups. There is a good correlation between birth weights
and BMI of mother (Fig 20).
4.3.122 A significant fall in birth weight has been observed in anaemic women; low birth weight rate doubles when Hb levels fall below 8 gms/dl. There is an urgent need to screen all pregnant women and provide food supplements to those with weight less than 40 kg. Effective antenatal care including detection and treatment of anaemia are equally important. Data from studies carried out in NIN indicate that by good antenatal care and utilisation of available food supplements it would be possible to improve birth weight and achieve sustained reduction in low birth weight rates. During Ninth Plan this approach will be implemented throughout the country, through the RCH and ICDS programmes.