Chapter
3:
PLAN
IN OUTLINE
Size of the Plan and Pattern of Outlay
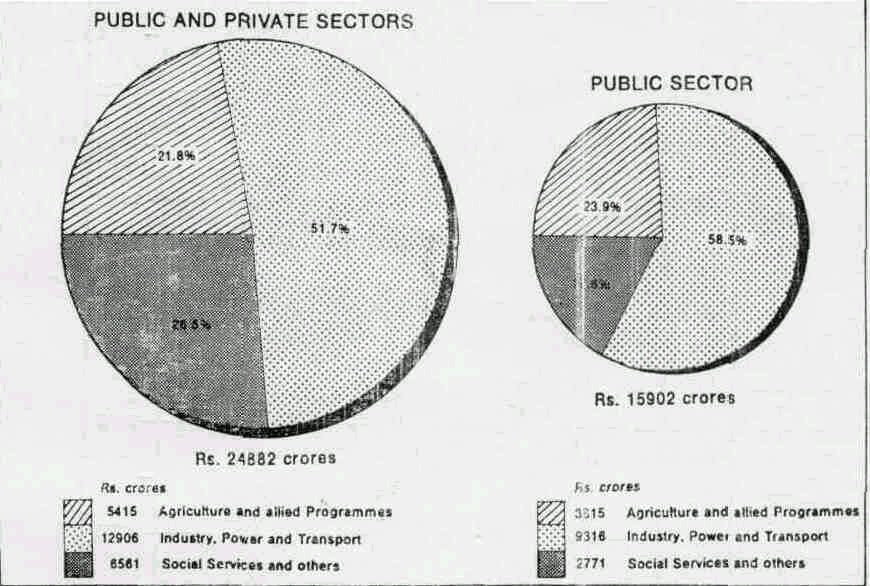
A total outlay of Rs. 24,882 crores is envisaged for the Fourth Plan. of the aggregate outlay, Rs. 15,902 crores is in respect of the public sector Plan and Rs, 8,980 crores for the private sector. In the public sector Rs. 13,655 crores have been provided for investment and Rs. 2,247 crores for current outlay. The total investment for the creation of productive assets aggregates to Rs. 22,635 crores. Table I indicates the distribution of the public and private sector outlays by major heads of development.
3.2. The estimates of development outlays do not include most of the expenditures by local bodies out of their own resources on development schemes. Expenditure on the maintenance of developmental services and institutions established during the earlier Plans as well as the Annual Plan years (1966-69) will be provided for in the normal budgets and does not form pan of Plan outlay. Table 2 shows the pattern of investment by the public and private sectors as envisaged in the Fourth Plan compared to the pattern in the Third Plan
Table
1 Fourth Plan Onllay and Investment Public and Private Sectors
(Rs. crores)
| Sl
No.
|
head of development | public sector |
private sector |
public and private sectors | ||||||
| total outlay | current outlay | investm
-ent |
%
distribution of total outlay (col. 2) |
investment | %distribution of investmen (col. 6) | total invest- ment (44-6) | total outlay (2+6) | % distribution of total outlay (col. 9) | ||
| (0) | (1) | (2) | (3) | (4) | (5) | (6) | (7) | (8) | (9) | (10) |
| 1 | agriculture and allied sectors . | 2728 | 610 | 2118 | 17.1 | 1600 | 17.8 | 3718 | 4328 | 17.4 |
| 2 | irrigation and flood control . | 1087 | 14 | 1073 | 6.8 | — | — | 1073 | 1087 | 4.4 |
| 3 | power | 2448 | — | 2448 | 15.4 | 75 | 0.8 | 2523 | 2523 | 10.1 |
| 4 | village and small industries . | 293 | 107 | 186 | 1.8 | 560 | 6.2 | 746 | 853 | 3.4 |
| 5 | industry and minerals | 3338 | 40 | 3298 | 21.0 | 2000 | 22.3 | 5298 | 5338 | 21.4 |
| 6 | transport and communications | 3237 | 40 | 3197 | 20.3 | 955 | 10.6 | 4152 | 4192 | 16.8 |
| 7 | education | 823 | 545 | 278 | 5.2 | 50 | 0.6 | 328 | 873 | 3.5 |
| 8 | scientific research | 140 | 45 | 95 | 0.9 | — | — | 95 | 140 | 0.6 |
| 9 | health | 434 | 303 | 131 | 2.7 | — | — | 131 | 434 | 1.7 |
| 10 | family planning | 315 | 262 | 53 | 2.0 | — | — | 53 | 315 | 1.3 |
| 11 | water supply and sanitation | 407 | 405 | 2.6 | — | — | 405 | 407 | 1.6 | |
| 12 | housing, urban and regional development | 237 | 235 | 1.5 | 2140 | 23.9 | 2375 | 2377 | 9.6 | |
| 13 | welfare of backward classes | 142 | 142 | — | 0.9 |
|
— | — | 142 | 0.6 |
| 14 | social welfare | 41 | 41 | — | 0.3 | — | — | — | 41 | 0.2 |
| 15 | labour welfare and craftsmen training | 40 | 20 | 20 | 0.3 |
|
|
20 | 40 | 0.2 |
| 16 | other programmes | 192 | 74 | 118 | 1.2 | — | 118 | 192 | 0.8 | |
| 17 | inventories | — | — | — | — | 1600 | 17.8 | 16.00 | 160 | 6.4 |
| Total | 15902 | 2247 | 13658 | 100.0 | 8980 | 100.0 | 22635 | 24882 | 100.0 | |
FOURTH PLAN OUTLAY : PUBLIC AND PRIVATE SECTORS
PUBLIC SECTOR OUTLAY AND EXPENDITURE
Table
2 : Pattern of Investment : Third and Fourth Plans
(Rs. crores)
| Sl. No. | head of development |
third plan |
fourth plan |
||||||
| public sector | private sector | total | percentage distribution of col. (4) | public
sector |
private sector | a-total | percentage distribution of col. (8) | ||
| (0) | (1) | (2) | (3) | (4) | (5) | (6) | (7) | (8) | (9) |
| 1 | agriculture and allied sectors. | 660 | 800 | 1460 | 14.0 | 2118 | 1600 | 3718 | 16.4 |
| 2 | irrigation and flood control. | 650 | — | 650 | 6.3 | 1073 | — | 1073 | 4.7 |
| 3 | power | 1012 | 50 | 1062 | 10.2 | 2448 | 75 | 2523 | 11.2 |
| 4 | village and small industries | 150 | 275 | 425 | 4.1 | 186 | 560 | 746 | 3.3 |
| 5 | industry and minerals | 1520 | 1050 | 2570 | 24.7 | 3298 | 2000 | 5298 | 23.4 |
| 6 | transport and communications | 3486 | 250 | 1736 | 16.7 | 3197 | 955 | 4152 | 18.3 |
| 7 | social services and other programmes | 622 | 1075 | 1697 | 16.3 | 1335 | 2190 | 3225 | 15.6 |
| 8 | inventorie- | 200 | 600 | 800 | 7.7 | — | 1600 | 1600 | 7.1 |
| 9 | Total | 6300 | 4100 | 10400 | 100.0 | 13655 | 8980 | 22635 | 100.0 |
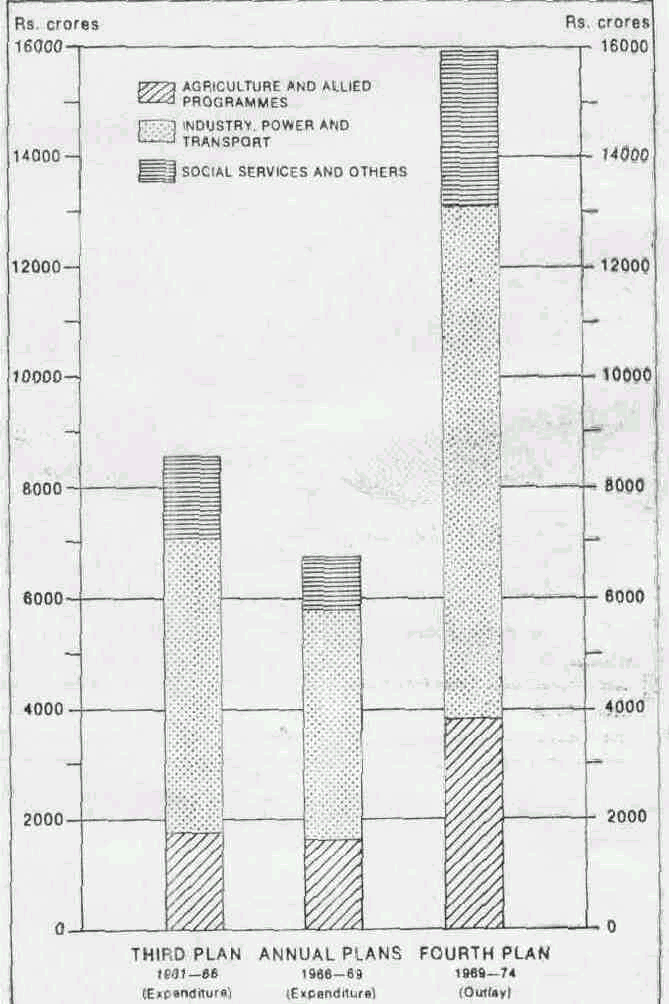
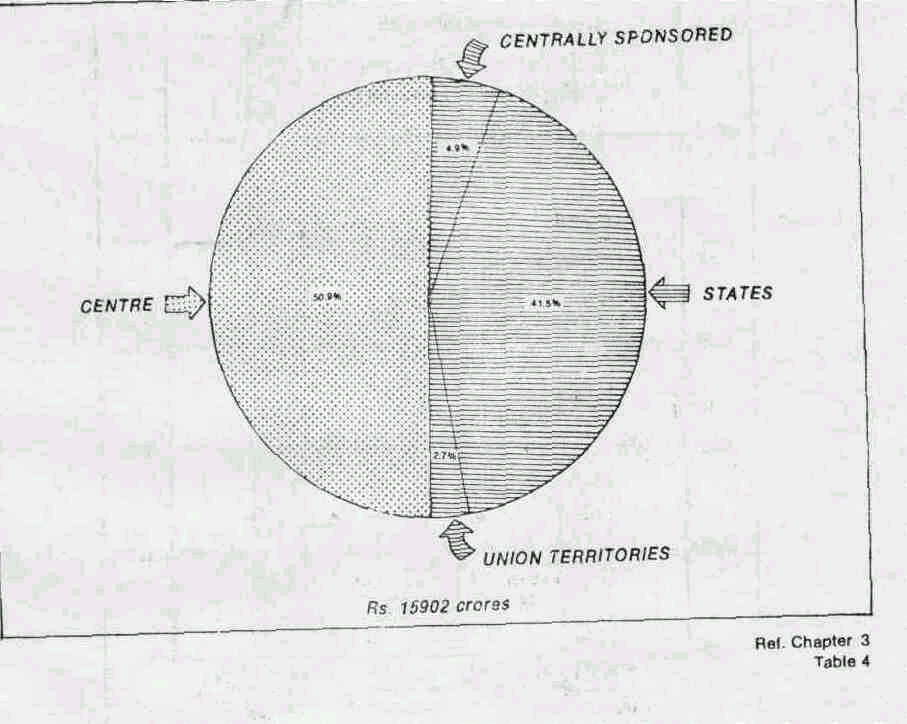
3.3 Table 3 compares the proposed public sector outlay in the Fourth Plan with the expenditure in the Third Plan and Annual Plans (1966—69) under each head of development. The total public sector outlay nf Rs. 15.902 crores in the Fourth Plan includes Rs. 8090 crores as outlay on Central schemes, Rs. 781 crores for Centrally sponsored schemes, Rs. 6606 crores in the States and Rs. 425 crores in the Union Territories. Compared to the Third Plan, substantially increased provision has been made in almost all^secfors. The more noteworthy increases are in respect of agriculture and allied sectors, power, industry, scientific research, family planning and water supply.
Table
3: Public Sector Outays in the Fourth Plan and Expenditure in
the Third Plan and Annual plans (1966—69)
(Rs. crores)
| Sl. No. | head of development | third plan | 1966—691 | fourth plan |
| (0) | (1) | (2) | (3) | (4) |
| 1 | agricniture and allied sectors | 1088.9 | 1166.6 | 2728.2 |
| 2 | irrgation and flood control | 664.7 | 457.1 | 1086.6 |
| 3 | power | 1252,3 | 1182.2 | 2447.6 |
| 4 | village and small industries | 240.8 | 144.1 | 293.1 |
| 5 | industry and minerals | 1726.3 | 1575.0 | 3337.7 |
| 6 | transport and communications | 2111.7 | 1239.1 | 3237.3 |
| 7 | education | 588.7 | 322.4 | 822.6 |
| 8 | scientific research | 71.6 | 51.1 | 140.3 |
| 9 | health | 225.9 | 140.1 | 433.5 |
| 10 | family planning | 24.9 | 75.2 | 315.0 |
| 11 | water supply and sanitation | 105.7 | 100.6 | 407.3 |
| 12 | housing, urban and regional development | 127.6 | 63.4 | 237.0 |
| 13 | welfare of backward classes | 99.1 | 68.5 | 142.4 |
| 14 | social welfare . | 19.4 | 12.1 | 41.4 |
| 15 | labour welfare and craftsmen trainning | 55.8 | 35.5 | 39.9 |
| 16 | other programmes | 173.1 | 123.5 | 192.3 |
| 17 | Total | 8576.5 | 6756.5 | 15902.2 |
'Subject to final adjustments.
Central Assistance
3.4. The principles of allocation and the pattern of Central assistance to the State have also undergone a change. Many States had expressed a view that the Central assistance for State Plans should be distributed in accordance with certain objective criteria. The question was, therefore, placed before the Committee of Chief Ministers of the National Development Council. It was decided that after providing for the requirements of the States of Assam, Nagaland and Jammu and Kashmir, the Central assistance to the remaining States for the Fourth Plan be distributed to the extent of 60 per cent on the basis of their population, 10 per cent on their per capita income if below the national average and 10 per cent on the basis of tax effort in relation to per capita income, and that another 10 per cent be allotted in proportion to the commitments in respect of major continuing irrigation and power projects. The remaining 10 per cent. it was decided, should be distributed among the States so as to assist them in trackling certain special problems, like those relating to metropolitan areas, floods, chronically drought affected areas and tribal areas.
3.5. Hitherto the Plan schemes under different heads of development had their own patterns of assistance and the States could draw their grants or loans accordingly. Outlays under certain heads of development as also on some of the specified schemes were earmarked and could not be diverted to other heads of development or schemes. This involved procedure of estimation, intimation and payment of Central assistance led to a complicated system of accounting and delays in final financial adjustments.Another feature of this system was that comparatively more advanced States were able to obtain a larger proportion of Central assistance in the form of grant even though the total quantum of assistance from the Centre was less in comparison with the less advanced States as they could adopt, in view of their revenue position being comfortable, such schemes as would attract larger amounts of grant. In order to simplify the procedure for release of Central assistance, to avoid adoption of standard schemes unsuited to local conditions and needs as well as to ensure equity among States in regard to the grant assistance for the Plan, it has been decided that in future there will be no schematic patterns c'f assistance. Central assistance will not be related to any specific schemes or programme under the State Plans but would be give into the States through block grants and block loans. Each State will get a fixed proportion (30%) of Central assistance in the form of grant and the balance (70%) by way of loans. In order to ensure that the overall priorities of the Plan are adhered lo, outlays under certain heads of subheads of development and specified schemes will, however, be earmarked and will not be diverted to other heads of development. The distribution of Central assistance to the different States and the total size of their Plans are given in Annexure II. The details of distribution of outlays by each head of development for the Centre and the Centrally sponsored schemes are given in Annexures IV and V.
3.6. States will now have much greater initiative in the formulation of schemes and programmes. Till now the State Plans had been formulated by and large in terms of standard schemes which had been approved by the Central Ministries and the Planning Commission and which carried with them a quantum of assistance in the shape of loans and grants.
3.7. The decision that 60 per cent of the assistance should be distributed on the basis of population and that the States in which per capita incomes were below the national average should get another 10 per cent of the total assistance is a step towards the reduction of regional imbalances.
3.8. The distribution of Central assistance according to the formula accepted by the National Development Council reduces the uncertainties which have till now attended the process of fixing the size of the Five Year and Annual Plans of States. Central assistance being pre-determined, the size of the States' Plans will now be dependent largely on the efforts of the individual State to marshal its own resources for Plan programmes.
Centrally Sponsored Schemes
3.9. Ever since the First Plan, a variety of programmes had been launched through schemes in which uniform patterns of staffing and administrative organisations were laid down by the Centre. Thef usually carried with them substantial Central assistance during the Plan period. These were called Certrally sponsored schemes. The responsibility for financing the committed expenditure for these at the end of the Plan fell on the States,
3.10. The States felt that most of the programmes envisaged in these schemes could be more appropriately carried out by them through thtir own Plans. The Administrative Reforms Commission had also expressed a similar view in their report on the Machinery for Planning and suggested res-Iriction of the number of Centrally sponsored schemes to the barest minimum and simplification of their operation. It has been decided that in future only those Centrally sponsored schemes will be taken up which fulfil the following criteria :
- that they relate to demonstrations, pilot projects, surveys and research;
- that they have a regional or inter-State character;
- that they require lump sum provision to be made until they could be broken down territorially; and
- that they have an overall significance from the all-India angle.
3.11. The position was reviewed in the light of the above considerations and a shorter list of Cen-rally sponsored schemes was drawn up a^d approved by the Committee of the National Development Council in September 1968. The list contained 52 schemes compared to 92 originally included. Sub-sequantly the Planning Commission and the Ministry of Food, Agriculture, Community Development and Cooperation decided that the seven schemes to be administered by ICAR may be classified as purely Central schemes with the result that in the Fourth Five Year Plan 1969—74 the tot^l number of Centrally sponsored schemes is 47. Those schemes will hereafter be wholly financed by the Central Government. The outlay on these schemes is Rs. 781 crores. The Centrally sponsored schemes are mainly under agriculture, health, family planning and welfare of backward classes.
3.12. The distribution of outlay between the Centre, Centrally sponsored schemes. States and Union Territories under major heads of development is shown in table 4. Annexure I gives more detailed, information about the expenditure under variousr heads of development in the Third Plan and Annual Plans (1966—69) and the corresponding outlays in the Fourth Plan:
FOURTH PLAN (1969-74) PUBLIC SECTOR OUTLAY
STATE PLAN OUTLAYS AND EXPENDITURE
Table
4 : Distribution of Public Sector Outlays : Centre, Centrally
sponsored States and Union Territories
(Rs. crures)
| Sl. No. | head of development | centre | centrally sponsored | union territorie' | states | total |
| (0) | (1) | (2) | (3) | (4) | (5) | (6) |
| 1 | agriculture and allied sectors | 1104.26 | 126.83 | 71.58 | 1425.51 | 2728.18 |
| 2 | irrigation and flood control | 23.50 | — | 12.68 | 1050.39 | 1086.57 |
| 3 | power | 424.72 | 22.00 | 81.78 | 1919.07 | 2447.57 |
| 4 | vllage and small industries | 148.65 | 5.10 | 10.41 | 128.97 | 293.13 |
| 5 | industry and minerals | 3150.86 | — | 3.79 | 183.06 | 3337.71 |
| 6 | transport and communications | 2622.00 | 42.00 | 90.72 | 482.54 | 3237.26 |
| 7 | education | 241.00 | 30.00 | 51.77 | 499.89 | 822.66 |
| 8 | scientific research | 140.26 | — | — | 140.26 - | |
| 9 | health | 53.50 | 176.50 | 19.28 | 184.25 | 433.53 |
| 10 | family planning | — | 315.00 | — | 315.00 | |
| 11 | water supply and sanitation | 3.80 | 2.00 | 43.33 | 358.16 | 407.29 |
| 12 | housing, urban and regional development | 48.60 | — | 21.33 | 167.10 | 237.03 |
| 13 | welfare of backward classes | 6.50 | 59.50 | 4.95 | 77.43 | 142.38 |
| 14 | social welfare | 27.43 | 2.00 | 1.41 | 10.54 | 41.38 |
| 15 | labour welfare and craftsmen training | 10.00 | — | 2.88 | 27.02 | 39.90 |
| 16 | other programmes | 90.68 | — | 9.09 | 92.54 | 192.31 |
| 17 | Total | 8089.76 | 780.93 | 425.00 | 6606.47 | 15902.16 |
3.13. The outlay under agriculture does not fjlly reflect the anticipated ste up in as much as does not take into account the substantial investment to be financed in this sector by some of the finan:ial instituions, namely, agro-industries corporations, land development banks and central cooperative banks. The investment in agriculture to be financed by these institutions from resources other than Plan outlays would amount to Rs. 950 crores. The Rural Electrification Corporation will make a supporting investment of Rs. :150 crores. The relevant figures are:—
Table 5 : Investment in Agriculture from Different Financial Institutions
| investment loans advanced | 1969—74 | ||||||
| Sl. No. | institution — | 1966-67 | 1967-68 | 1968-69 | total investment loans to be financed | a-plan outlay | other resources to be raised |
| (0) | (1) | (2) | (3) | (4) | (5) | (6) | (7) |
| 1 | agriculture refinance corporation | 2 | 5.7 | 10.0 | 200.0 | 200.0 | |
| 2 | agro-industries corporations | — | ''— | 100.0 | 50.0 | 50.0 | |
| 3 | land development banks | 60.0 | 78.0 | 100.0 | 700.0 | 200.0 | 500.0 |
| 4 | central cooperative banks | 15.0 | 15.0 | 15.0 | 150.0 | 150.0 | |
| 5 | indian dairy corporation | — | — | — | 95.0 | 95.0 | |
| 6 | commercial banks | — | — | — | 250.0 | 250.0 | |
| 7 | Total | 77.1 | 98.7 | 125.0 | 1495.0 | 545.0 | 950.0 |
Centres Plan
3.14. The details of the requirements of Central projects were discussed with the Ministries concerned. Keeping in view the priorities and the essential needs of the economy, certain adjustment'; in the outlays of the various sectors have been made.While considering tile programmes to be included in the Plan in the Central sector, an attempt has also been made to identify more clearly and fully the programmes which were being financed through certain Central institutions to which funds wt-re flowing partly from the Central Government resources and partly from banking and other sectors. In
30 FOURTH FIVE YBAR PLAN
particular, mention has to be made of the resources to be raised by the Food Corporation of India for building up buffer stocks of foodgrains; and by term-lending institutions like the Industrial Development Bank. the Industrial Finance Corporation, the Industrial Credit and Investment Corporation and the Agricultural Refinance Corporation for tinancing Plau programmes.
State Plans
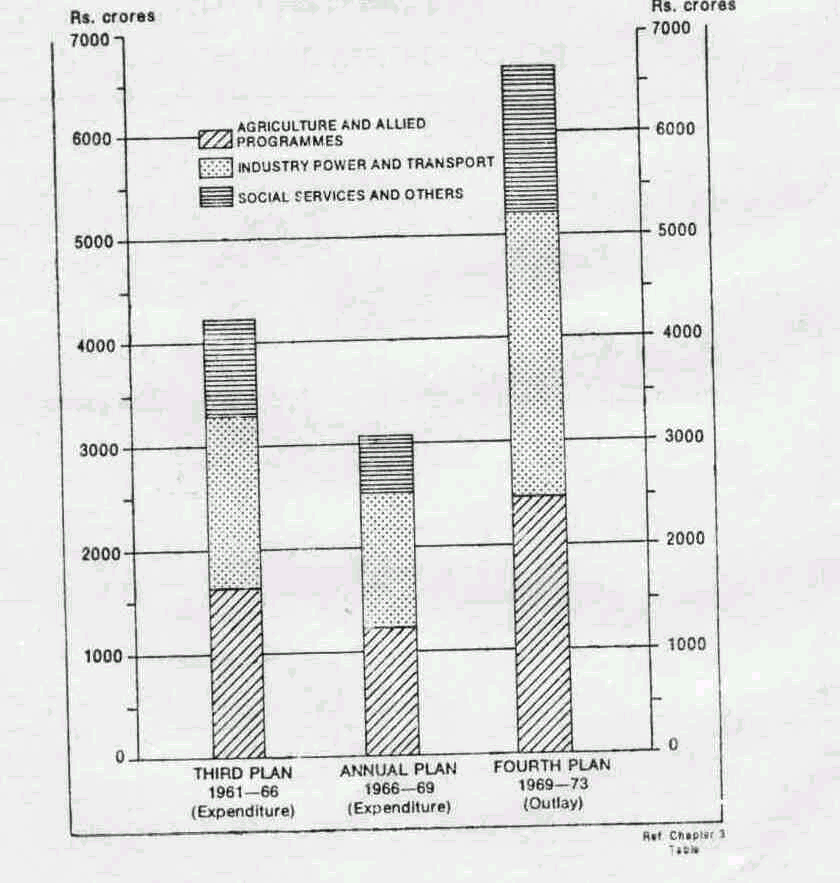
3.15. In the light of the reassessment of reasouces after the award of the Fifth Finance Commission and special accommodation to States in respect of their non-Plan dehcits, the State Plan outlays have now been put at Rs. 6606 crores for the Fourth Plan period. This will be supplemented by an outlay of Rs. 781 crores for Centrally sponsored schemes mainly under agriculture, health, family planning and welfare of backward classes. The Central Phin also includes provision to the extent of Rs. 545 crores by way of support to the State programmes through institutions like Agricultural Refinance Corporation, Land Development Banks, Rural Electrification Corporation and Indian Dairy Corporation. Provision has also been made in the Central sector Plan for a few schemes which will directly benefit the States. Among them are the schemes for small farmers and agricultural labourers (Rs. 115 crores), dry farming (Rs. 20 crores) and area development (Rs. 15 crores). Thus a significant proportion cf the additional outlay in the Central sector Plan is designed to support the development programmes included in the State Plans and the total Plan expenditure in States (excluding purely Central sector programmes, as for railways, large industries and ports) will be substantially larger than the outlays of State Plans.
Table:
Slate Plan Outlay by Major Heads of Development
(Rs. crores)
| Sl.No, | head of development | third plan | annual plans 1966—691 | fourth plan |
| (0) | (1) | (2) | (3) | (4) |
| 1 | agriculture and allied sectors | 972 | 779 | 1426 |
| 2 | irrigation and flood control | 655 | 448 | 1050 |
| 3 | power | 1139 | 970 | 1919 |
| 4 | industry and minerals | 203 | 146 | 312 |
| 5 | transport and communications | 294 | 210 | 483 |
| 6 | social services | 844 | 456 | 1324 |
| 7 | other programmes | 58 | 43 | 92 |
| 8 | Total | 4165 | 3052 | 6606 |
Subject to final adjustments
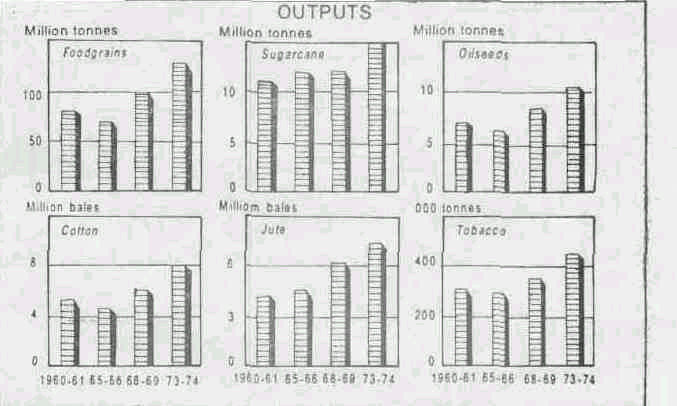
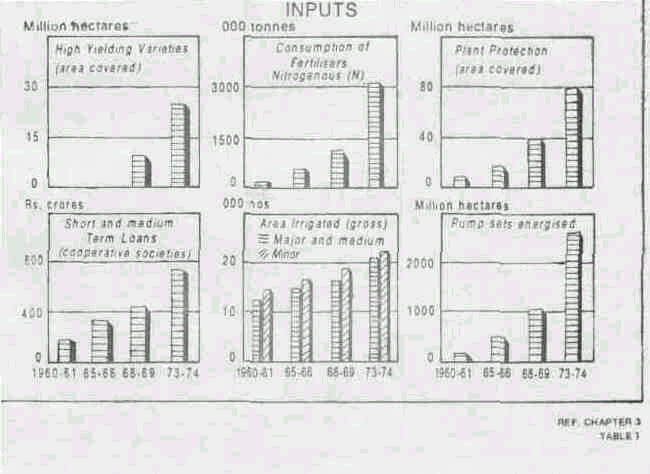
3.16. The targets aimed at and the results anticipated in selected fields are indicated in table 7 :
Table 7 : Selected Targets and Estimates
| Sl. item no. | unit | 1960-61 actuals | 1965-66 actuals | 1968-69 estimated | 1973-74 targets./ estimates | |
| (0) | (1) | (2) | (3) | (4) | (5) | (6) |
| agriculture and allied sectors | ||||||
| 1 | foodgrains production | mill. tonnes | 82 | 72 | 981 | 129 |
| 2 | sugarcane (in terms of gur) | mill. tonnes | 11.2 | 12.1 | 12.01 | 15 |
| 3 | oilseeds | mill. tonnes | 7 | 6.3 | 8.51 | 10.5 |
| 4 | cotton | mill. bales | 5.3 | 4.8 | 61 | 8 |
| 5 | jute | mill. bales | 4.1 | 4.5 | 6.21 | 7.4 |
| 6 | tobacco | thou. tonnes | 307 | 298 | 350 | 450 |
| 7 | high yielding varieties (area covered) | mill. hectares | — | — | 9.2 | 25 |
| consumption of fertilisers | ||||||
| 8 | nitrogenous (N) | thou. tonnes | 210 | 550 | 1145 | 3200 |
| 9 | phosphatie (P,0s) | thou. tonnes | 70 | 130 | 391 | 1400 |
| 10 | potassic (K.a 0) | thou. tonnes | 26 | 80 | 160 | 900 |
| 11 | plant protection (area covered) | mill. hectares | 6.5 | 16.6 | 40 | 80 |
| 12 | short and medium term loans advanced by primary cooperative credit societies | Rs. crores | 203 | 342 | 490 | 750 |
| 13 | membership of agricultural cooperative credit societies | mill. numbers | 17 | 26 | 30 | 42 |
| area irrigated (gross) | ||||||
| 14 | major and medium | mill. hectares | 13.1 | 15.2 | 16.9 | 20.8 |
| 15 | minor | mill. hectares | 14.8 | 17 | 19 | - 22.2 |
| 16 | agricultural pumpssts energised | thou. numbers | 191.8 | 512.9 | 1087.6 | 2337 |
AGRICULTURE AND ALLIED PROGRAMMES
SELECTED OUTPUT AND INPUT
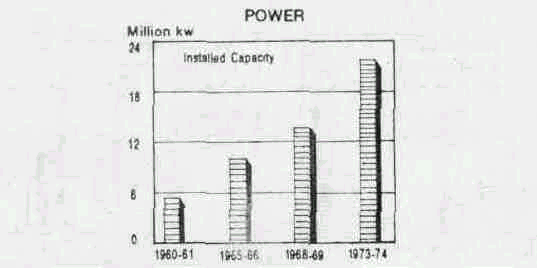
INDUSTRY AND MINERALS
Selected Production Targets and Achievements
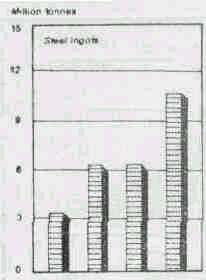
Table 7—Contd.
| (0) | (1) | (2) | (3) | (4) | (5) | (6) |
| industry and minerals | ||||||
| 17 | steel ingots. | mill. tonnes | 3.42 | 6.5 | 6.5 | 10.8 |
| 18 | alloy and special steel | thou. tonnes | — | 40 | 43 | 220 |
| 19 | aluminium | thou. tonnes | 18.3 | 62.1 | 125.3 | 22C |
| 20 | machine tools | Rs. erores | 7 | 29 | 24.7 | 65 |
| 21 | sulphuric acid | thou. tonnes | 368 | 662 | 1038 | 2500 |
| 22 | caustic soda | thou. tonnes | 101 | 218 | 304 | 500 |
| 23 | soda ash | thou. tonnes | 152 | 331 | 405 | 550 |
| 24 | refinery products (in terms of crude throughput) | mill. tonnes | 5.8 | 9.4 | 15.4 | 26.0 |
| 25 | petroleum crude | mill tonnes | 0.41 | 3.02 | 6.06 | 8.5 |
| 26 | paper and paper board | thou. tonnes | 350 | 558 | 647 | 850 |
| 27 | plastics | thou. tonnes | 9.5 | 31.3 | 58.1 | 225 |
| fertilisers production | ||||||
| 28 | nitrogenous(N) | thou. tonnes | 101 | 232 | 541 | 2500 |
| 29 | phosphatic (PaO;) | thou. tonnes | 53 | 123 | 210 | 900 |
| 30 | cement | mill. tonnes | 8 | 10.8 | 12.2 | 18 |
| cfort | ||||||
| 31 | mill made | mill. metres | 4649 | 4401 | 4297 | 5100 |
| 32 | man-made fabrics | mill. metres | 546 | 870 | 1090 | 1500 |
| 33 | handloom, powerloom and khadi | mill. metres | 2067 | 3141 | 3596 | 4250 |
| minerals | ||||||
| 34 | iron ore | mill. tonnes | 11 | 24.5 | 28.1 | 51'4 |
| 35 | coal excluding lignite | mill. tonnes | 55.7 | 67.7 | 71.5 | 93.5 |
| WMW | ||||||
| 36 | installed capacity | mil!, kw. | 5.65 | 10.17 | 14.29 | 23 |
| transport | ||||||
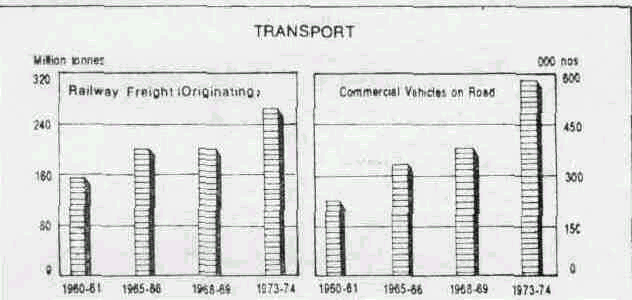
| 37 | railway freight originating . | mill. tonnes | 156 | 203 | 204 | 265 |
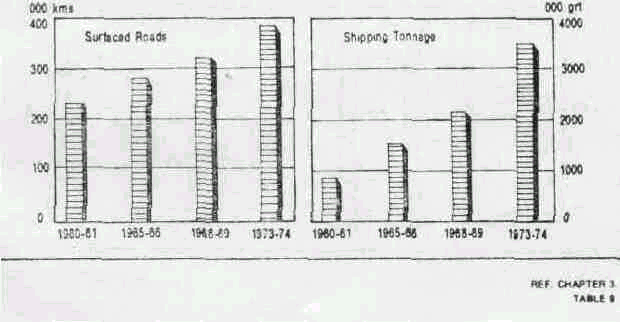
| 38 | surfaced roads | thou. kms. | 236 | 287 | 325 | 385 |
| 39 | commercial vehicles on road | thou. nos. | 225 | 333 | 386 | 585 |
| 40 | shipping tonnage | thou. grt | 857 | 1540 | 2140 | 3500 |
| education general education | ||||||
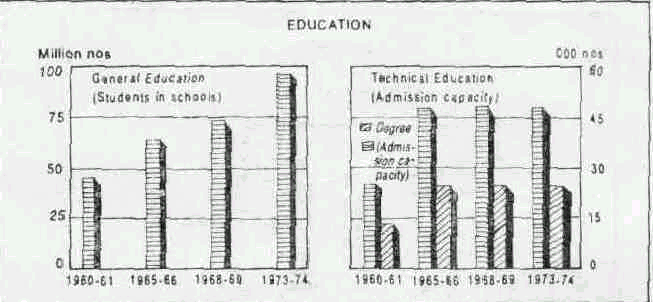
| 41 | students in schools | mill. numbers | 44.7 | 66.3 | 74.3 | 96.4 |
| technical education—admission capacity | ||||||
| 42 | degree | thou. numbers | 13.8 | 24.7 | 25 | 25 |
| 43 | diploma | thou. numbers | 25.8 | 48 | 48.6 | 48.6 |
| Health | ||||||
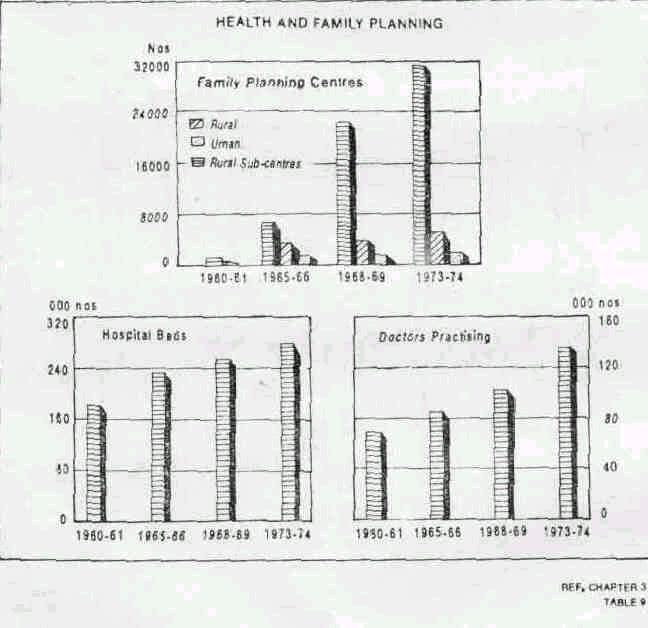
| 44 | hospital beds | thou. numbers | 185.6 | 240.1 | 255.7 | 281.6 |
| 45 | doctors practising | thou. numbers | 70 | 86 | 102.5 | 137.9 |
| family planning | ||||||
| 46 | rural centres | . numbers | 1100 | 3676 | 4326 | 5225 |
| 47 | rural sub-centres | . numbers | — | 7081 | 22826 | 31752 |
| 48 | urban centres | . numbers | 549 | 1381 | 1797 | 1856 |
'base level.
3.17. On the basis of the programme of investments proposed for the Fourth Plan and the level of outputs expected to be reached in different sectors by 1973-74, it is estimated that the overall 'at^ of growth during the Fourth Plan will be about five and a half per cent a year. Detailed sectors! estimates are presented in Table 8.
Table
8 : Estimates of Net National Product : 1968-69 to 1973-74
(Rs. crores at 1968-1969-prices)
| Sl. No. | item | 1968-69 | 1973-74 |
| (0) | (1) | (2) | (3) |
| 1 | agriculture | 4250 | |
| 2 | forestry and logging | 4.1 | 53 |
| 3 | fishing | 165 | |
| 4 | wb-total | 14864 | 1895) |
| 5 | mining and quarrying | 317 | 465 |
| 6 | large seal; msnufactiiring. | 2242 | 3490 |
| 7 | small scale manufacturing | 3559 | 3011 |
| 8 | construction | 1142 | 1722 |
| 9 | electricity, gas and water supply | 237 | 270 |
| 10 | sub-total | 5497 | 8058 |
| 11 | transport and communications | 1309 | 1785 |
| 12 | railways | 469 | 595 |
| 13 | communications | 181 | 265 |
| 14 | transport by other means, | 659 | 925 |
| 15 | trade, storage, hotels and restaurants | 3105 | 4357 |
| 16 | sub-total | 44!4 | 6142 |
| 17 | banking and insurance | 440 | 554 |
| 18 | real estate and ownership of dwellings | 675 | 797 |
| 19 | public administration and defence | 1308 | 1444 |
| 20 | other sen ices | 1873 | 2360 |
| 21 | Sub-total | 4296 | 5155 |
| 22 | net domestic product | 29071 | 38306 |
| 23 | net factor income from aborad | (-)270 | (-)408 |
| 24 | net national product at factor cost or | 28801 | 37898 |
| national income | or | or | |
| 28800 | 37900 | ||
3.18. According to the estimates of the Registrar General, population is expected to grow at the rate of 2.5 per cent per year during the five year period. The increase in per capita income over the Plan period will be about 3 per cent per year. In order to realise the rate of growth postulated, it will be necessary to. step up the rate of domestic savings from the level of 8.8 per cent in 1968-69 to 13.2 per cent and that of investment from 11.3 per cent to 14.5 per cent by the end of the Plan. The increase in foodgrains output visualised in the Plan will pnab'e the country to dispense with concessional food imports by 1971. Efforts will be made to limit the growth of non-food imports to 5.5 per cent per year while securing an annual increase of 7 per cent in exports. As a result, the requirements of foreign aid, net of debt repayment and interest payments, in the" terminal year of the Plan will be brought down to about half the level in 1968-69. A detailed discussion of the programmes designed to achieve these objectives appears in 'the succeeding chapters. Table 9 'yves a few selected macro-economic pro jections for the Fourth Plan :
Table 9 : Macro-Economic Projections : 1968-69 and 1973-74
| Sl. No. | unit | 1968-69 | 1973-74 | |
| (0) | (1) | (2) | (3) | (4) |
| 1 | national-incomeR' : at | crores 1968-69 prices | 28803 | 37900 |
| 2 | population (mid year-october 1) | million | 527 | 596 |
| 3 | per capita income | rupees | 546 | 636 |
| 4 | domestic savings as percentage of national income | per cent | 8.8 | 13.2 |
| 5 | net investment as percentage of national income | per cent | 11.3 | 14.5 |
POWER AND TRANSPORT
SELECTED TARGETS AND ACHIEVEMENTS
EDUCATION, HEALTH AND FAMILY PLANNING
SELECTED TARGETS AND ACHIEVEMENTS
ANNEXURE
I Public
Sector Outlay in the Fourth Plan and Expenditure ill the
Third Plan and Anticipated Expenditure during 1969.
(Rs. crores)
| Sl. No. | head of development | third plan | 1966-69 | Fourth Plan |
| (0) | (1) | (2) | (3) | (4) |
| 1 | agriculture and allied sectors | 1083.9 | 1166.6 | 2728.2 |
| 2 | agricultural production including research and education | 202.5 | 252.5 | 505.2 |
| 3 | development of small fanners and agricultural labour | — | — | 115.0 |
| 4 | minor irrigation | 270.1 | 314.1 | 515.7 |
| 5 | soil conservation | 77.0 | 87.9 | 159.4 |
| 6 | area development | 2.3 | 13.1 | 38.3 |
| 7 | animal husbandry | 43.4 | 34.0 | 94.1 |
| 8 | dairying and milk supply | 33.6 | 25,7 | 139.0 |
| 9 | fisheries | 22.5 | 36.9 | 83.3 |
| 10 | forests | 46.0 | 44.1 | 92.5 |
| 11 | warehousing, marketing and storage | 27.4 | 15.0 | 94.0 |
| 12 | food processing and subsidiary food . | — | — | 18.6 |
| 13 | central support to financial institutions (agricultural sector) | — | 40.0 | 324.0 |
| 14 | buffer stocks | — | 140,0 | 255.0 |
| 13 | cooperation | 75.6 | 63.9 | 178.6 |
| 16 17 | community development panchayats | 276.8 | 99.4 | 115.5 |
| 18 | irrigation, food control, etc. | 664.7 | 457.1 | 1086.6 |
| 19 | irrigation | 583.2 | 414.1 | 953.8 |
| 20 | flood control, etc. | 81.5 | 43.0 | 132.8 |
| 21 | power | 1252.3 | 1182.2 | 2447.6 |
| 22 | village and small Industries | 240.8 | 144.1 | 293.1 |
| 23 | industry and minerals | 1726.3 | 1575.0 | 3337.7 |
| 24
25 |
organised
industries
mineral development |
1726.3 | 1575.0 | 2676.6 |
| 26 | transport and communications | 2111.7 | 1239.1 | 661.1 |
| 27 | railways | 1325.5 | 525.8 | 1050.0 |
| 28 | roads | 439.6 | 308.2 | 870.9 |
| 29 | road transport | 26.7 | 53.7 | 92.7 |
| 30 | ports and harbours | 92.9 | 55.3 | 195.0 |
| 31 | shipping | 40.4 | 25.4 | 140.8 |
| 32 | inland water transport | 4.0 | 6.2 | 11.7 |
| 33 | lighthouses | 4.0 | 1.7 | 7.0 |
| 34 | civil air transport and air corporations | 48.9 | 69.7 | 203.2 |
| 35 | tourism | 4.7 | 8.7 | 36.0 |
| 36 | posts and telegraphs | 110.3 | 117.8 | 492.2 |
| 37 | other communications | 6.4 | 9.3 | 27.8 |
| 38 | broadcasting | 8.3 | 12,0 | 40.0 |
| 39 | farakka barrage | — | 45,3 | 70.0 |
| 40 | social services | 1353.6 | 894.3 | 2579.4 |
| 41 | general education and cultural programmes | 463.9 | 240.9 | 677.2 |
| 42 | technical education | 124.8 | 81.5 | 125.4 |
| 43 | scientific research | 71.6 | 51.1 | 140.3 |
| 44 | health | 225.9 | 140.1 | 433.5 |
| 45 | family planning | 24.9 | 75.2 | 315.0 |
| 46 | water supply | 105.7 | 100.6 | 407.3 |
| 47 48 | housing
urban and regional development . |
127.6 | 45.51 17.9 | 237.0 |
| 49 | welfare of backward classes | 99.1 | 68.5 | 142.4 |
| 50 | social welfare | 19.4 | 12.1 | 41.4 |
| 51 | labour welfare and craftsman training | 55.8 | 35.5 | 39.9 |
| 52 | pubiic cooperation | 1.9 | 69 | — |
| 53 | local works | 13.7 | — | — |
| 54 | rural works | 19.3 | 18.5 | — |
| 55 | other programmes | 138.2 | 98.1 | 192.3 |
| 56 | rehabilitation | 48.4 | 39.5 | 66.0 |
| 57 | statistics | 4.4 | 11.7 | |
| 58 | information and publicity | 4.0 | 12.5 | |
| 59 | state capital projects | 25.4 | 30.7 | |
| 60 | special and backward areas | 89.8 | 13.3 | 43.6 |
| 61 | evaluation machinery | 0.3 | 0.9 | |
| 62 | expansion of printing capacity | 3.1 | 11.6 | |
| 63 | research programmes committee | 0.6 | 0.6 | |
| 64 | others | 7.5 | 14.7 | |
| 65 | Total | 8576.5 | 6756.5 | 15902.3 |
Subject to final adjustments.
ANNEXURE
II Fourth Five Year Plan—Stales' Outlays
(Rs. crores)
| Sl.No. | state | states' resoure | central es assistan | total oe outlay |
| (0) | (1) | (2) | (3) | (4) |
| 1 | Andhra Pradesh | 180.50 | 240.00 | 420.50 |
| 2 | Assam | 41.75 | 220.00 | 261.75 |
| 3 | Bihar | 193.28 | 338.00 | 531.28 |
| 4 | Gujarat | 297.00 | 158.00 | 455.00 |
| 5 | Haryana | 146.50 | 78.50 | 225.00 |
| 6 | Jammu and Kashmir | 13.40 | 145.00 | 158.40 |
| 7 | Kerala | 83.40 | 175.00 | 258.40 |
| 8 | Madhya Pradesh | 121.00 | 262.00 | 383.00 |
| 9 | Maharashtra | 652.62 | 245.50 | 898.12 |
| 10 | Mysore | 177.00 | 173.00 | 350.00 |
| 11 | Nagaland | 5.00 | 35.00 | 40.00 |
| 12 | Orissa | 62.60 | 160.00 | 222.60 |
| 13 | Punjab | 192.56 | 101.00 | 293.56 |
| 14 | Rajasthan | 82.00 | 220.00 | 302.00 |
| 15 | Tamil Nadu | 317.36 | 202.00 | 519.36 |
| 16 | Uttar Pradesh | 439.00 | 526.00 | 965.00 |
| 17 | West Bangal | 101.50 | 221.00 | 322.50 |
| 18 | Total | 3106.47 | 3500.00 | 6606.47 |
ANNEXURE
III Fourth Five Yew Plan— territories' Outlays
(Rs. crores)
| Sl. No. union territory outlay | ||
| (0) | (1) | (2) |
| 1 | Andaman and Nicobar Islands | 14.00 |
| 2 | Chandigarh | 7.75 |
| 3 | Dadra and Nagar Haveli | 2.30 |
| 4 | Delhi | 162.65 |
| 5 | Goa, Daman and Diu | 39.50 |
| 6 | Himachal Pradesh | 101.40 |
| 7 | Laccadive, Amindivi and Minicoy Islands | 2.00 |
| 8 | Manipur | 30.25 |
| 9 | NEFA | 17.99 |
| 10 | Pondicherry | 12.50 |
| 11 | Tripiira | 34.66 |
| 12 | Total | 425 |
ANNEXURE
IV Fourth Five Year Plan-Central Schemes
(Rs. crores)
| Sl.No. | head of development | outlay |
| (0) | (1) | (2) |
| 1 | agricultural aitd allied sector | 1104.26 |
| 2 | agricultural production | 19.64 |
| 3 | development of small farmers and agricultural labour | 115.00 |
| 4 | research and education | 85.00 |
| 5 | minor irrigation | 8.00 |
| 6 | soil conservation | 0.63 |
| 7 | area development | 16.26 |
| 8 | animal husbandry | 12.50 |
| 9 | dairying and milk supply . | 97.25 |
| 10 | fisheries | 28.00 |
| 11 | forests | 3.73 |
| 12 | ware-housing, marketing and storage | 87.00 |
| 13 | food processing and subsidiary food | 16.10 |
| 14 | centra! support to financial institutions (agricultural sector) | 324.00 |
| 15 | buffer stocks | 255.00 |
| 16 | cooperation | 30.25 |
| 17
18 |
community
development.1, Panchayats |
5.80 |
| 19 | irrigation,, flood control, etc | 23.50 |
| 20 | irrigation . | 15.50 |
| 21 | flood control, etc. | 8.00 |
| 22 | power | 424.72 |
| 23 | village and small industries | 148.65 |
| 24 | industry and minerals | 3150.86 |
| 25 | metals | 1236.68 |
| 26 | machinery and engineering | 174.70 |
| 27 | fertilisers and pesticides | 495.95 |
| 28 | intermediates | 212.09 |
| 29 | consumer goods | 42.37 |
| 30 | atomic energy | 64.25 |
| 31 | other schemes | 291.87 |
| 32 | mineral development | 632.94 |
| 33 | transport and communications | 2622.00 |
| 34 | railways | 1050.00 |
| 35 | roads | 303.00 |
| 36 | road transport | 3.00 |
| 37 | ports and harbours | 167.00 |
| 38 | shipping | 140.00 |
| 39 | inland water transport | 5.00 |
| 40 | lighthouses | 7.00 |
| 41 | civil all-transport and air corporations | 202.00 |
| 42 | tourism | 25,00 |
| 43 | posts and telegraphs | 492.20 |
| 44 | other comrminication' | 27.80 |
| 45 | broadcasting | 40.00 |
| 46 | farakka barrage | 70.00 |
| 47 | social services | 528.09 |
| 48 | general education and cultural programnw, | 185.70 |
| 49 | technical education | 55.30 |
| 50 | scientific research | 140.26 |
| 51 | health | 53.50 |
| 52 | water supply and sanitation | 3.80 |
| 53 | housing, urban and regional development | 48.60 |
| 54 | welfare of backward classes | 0.50 |
| 55 | social welfare | 27.43 |
| 56 | labour welfare and craftsmen training | 10.00 |
| 57 | other programmes | 90.68 |
| 58 | rehabilitation | 66.00 |
| 59 | statistics | 7.91 |
| 60 | information and publicity | 5.00 |
| 61 | expansion of printing capacity | 10.00 |
| 62 | research programmes committee | 9.60 |
| 63 | others | 1 17 |
| 64 | Total | 8089.76 |
ANNEXURE
V Fourth Five Yew Plan—Centrally Sponsored Schemes
(Rs. crore)
| Sl. No |
head of development |
outlay |
| (0) (1) | (2) | |
| 1 | agriculture and allied sectors | 126.83 |
| 2 | agricultural production | 46.30 |
| 3 | soil conservation . | 29.44 |
| 4 | animal husbandry. | 5.25 |
| 5 | fisheries . | 6.00 |
| 6 | forests | 1.39 |
| 7 | food processing and subsidiary food | 2.50 |
| 8 | cooperation | 24.50 |
| 9 | community development and panchayats . | 11.45 |
| 10 | power | 22.00 |
| 11 | village and small industries | 5.10 |
| 12 | transport and communications | 42.00 |
| 13 | roads | 25.00 |
| 14 | ports and harbours | 13.00 |
| 15 | Inland water transport | 4.00 |
| 16 | social services | 585.00 |
| 17 | general education and cultural programmes | 18.20 |
| 18 | technical education | 11.80 |
| 19 | health | 176.50 |
| 20 | family planning | 315.00 |
| 21 | water supply | 2.00 |
| 22 | welfare of backward classes | 59.50 |
| 23 | social welfare | 2.00 |
| 24 | Total | 780.93 |