Introduction
1.1 The Eighth Five Year Plan (1992-97) was launched immediately after the initiation of a set of stabilisation and structural adjustment measures, which were designed to combat the then prevailing crisis in the balance of payments (BoP) and resources position of the Government, in 1991. The Plan took into account some of the changes that were expected to come about due to these reforms. The Plan also kept in view the poor performance of the economy in the base year (1991-92). The overall growth was estimated to be negligible during the base year. The annual inflation rate was ruling at double-digit level. On the balance of payments front, although there was some improvement in the foreign exchange reserves, exports were exceptionally sluggish. Given this performance of the economy in 1991-92, the Eighth Plan set down somewhat cautious macroeconomic targets. The plan aimed at an annual average growth rate of 5.6 per cent and an average industrial growth rate of about 7.5 per cent. These growth targets were planned to be achieved with relative price stability and a substantial improvement in the country's balance of payments. It was envisaged that the ratio of current account deficit will be maintained at about 1.6 per cent. The performance of the economy during the first four years of the Plan indicate that most macro-economic targets would be achieved by the end of the terminal year (1996-97).
Growth and Sectoral Output
1.2 In 1991-92, the base year of the Eighth Plan, and the first year of the economic reforms, GDP grew by less than 1 per cent as compared to an annual average growth at about 6 per cent during the Seventh Plan period. However, the economy soon absorbed the shock of the stabilisation measures and recovered within a year to record 5.1 per cent growth in 1992-93. The growth rate accelerated to 6.2 per cent in 1993-94 and over 7 per cent in the following two years. Thus, on an average, GDP has grown by 6.4 per cent during the first four years of the Eighth Plan. Despite some early indications of slowdown of industrial growth in 1996-97 (the last year of the Plan), GDP may still grow at over 6 per cent. Accordingly, the average growth of GDP during the Eighth Plan is expected to be a little over 6 per cent which is significantly higher than the Plan target of 5.6 per cent.
1.3 The growth performance of the economy reflects in good measure the successive good performance of the agricultural sector. After recording a decline of 2.3 per cent in 1991-92, agricultural GDP increased at an average growth rate of about 4.8 per cent per annum during the first three years of the Plan, before recording a marginal decline in 1995-96. Foodgrains production increased steadily from about 168 million tonnes in 1991-92 to about 191 million tonnes in 1994-95. Latest estimates suggest that the output offoodgrains during 1995-96 may be considerably lower at 185 million tonnes. However, following good monsoon during 1996, the production offoodgrains is likely to bounce back to its 1994-95 level or even exceed it. Overall, the growth of agricultural GDP during the Eighth Plan may be slightly above the targetted growth rate of 3.1 percent.
1.4 On the industrial front, all the major segments witnessed severe recession during 1991-92. The index of industrial production grew by less than 1 per cent during 1991-92. The index of manufacturing production declined by about 1 per cent. GDP from industry, which had grown at about 7.5 per cent during the Seventh Plan period, registered a decline of 1.9 per cent in 1991-92. Since then its growth has picked up substantially to 4.3 per cent in 1992-93, 7.9 per cent in 1993-94, 9.9 per cent in 1994-95, and about 12.7 per cent in 1995-96. Thus the average growth of industrial GDP during the first four years of the Plan has been about 8.7 per cent. Despite indications of some slowdown in industrial production during 1996-97, industrial GDP may still grow at over 9 per cent in the terminal year of the Plan. Thus, the expected growth of industrial GDP at about 8.8 per cent per annum will be significantly higher than the Eighth Plan target of 7.5 per cent.
1.5 The performance of the service sector during the first four years of the Eighth Plan has been consistently good. Even during the height of recession during the base year of the Plan (1991-92),the service sector performed well by growing at about 5 per cent. The service sector, consisting of trade, transport, communication, finance, insurance and community and social services has grown at an average of over 7 per cent during the first four years of the Plan. In the terminal year (1996-97) of the Plan, the service sector is expected to grow at over 7 per cent. Thus, the target of 6.2 per cent set for the service sector in the Eighth Plan is likely to be exceeded by a significant margin. However, the creation of new capacities in a number of sectors has fallen significantly short of the target during the Eighth Plan, primarily due to the slower pace of investment.
Savings and Investment
1.6 Gross domestic savings as a proportion of GDP averaged 23.2 per cent during 1992-93 to 1995-96. The savings rate which was relatively low, at 21.1 per cent in the first two years, staged a dramatic recovery in 1994-95. A record private corporate savings rate of 3.9 per cent and a substantial recovery of household savings rate at 19.2 per cent helped push the gross domestic savings rate to a new peak of 24.9 per cent in 1994-95. Quick estimates of the CSO indicate that savings rate has moved upwards to 25.5 per cent during 1995-96 despite decline of household financial savings rate by about 2 percentage points.
1.7 Gross domestic investment (adjusted for errors and omissions) as a proportion of GDP averaged 24.5 per cent during 1992-93 to 1995-96. The investment rate which was relatively low at 22.3 per cent during the first two years of Eighth Plan, received a boost in 1994-95. A relatively higher savings rate at 24.9 per cent and a current account deficit of about 1 per cent of GDP pushed the investment rate to 26 per cent in 1994-95. With the savings rate estimated to be around 25.5 per cent and the current account deficit estimated at about 1.7 per cent of GDP, the investment rate during 1995-96 may exceed 27 per cent of GDP.
Fiscal Developments
1.8 The Eighth Plan document stated that a major aim of fiscal policy should be to roll back the fiscal deficit of the Centre and the States, taken together as a percentage ofGDP, from an average of 10.6 per cent during the Seventh Plan and from about 11 per cent in 1990-91, to an average of about 7 per cent during the Eighth Plan period. This implicitly meant that the Centre's fiscal deficit would be required to be brought down to an average of 5 per cent, and that of the States to an average of about 2 per cent, during the Eighth Plan period. Fiscal developments during the Eighth Plan period suggest that these targets, despite conscious efforts, would remain unfulfilled. The fiscal deficits of the States and the Centre during the fall five year period is likely to remain at about 3 and 6 per cent ofGDP, respectively.
1.9 Though on average the Centre's fiscal deficit at about 6 per cent of GDP during the Eighth Plan period appears high, it represents significant reduction from its level in 1990-91. Over the past six budgets, the fiscal deficit of the Centre has declined from 8.3 per cent in 1990-91 to a budgeted 5 per cent in 1996-97. More significantly, the primary deficit of the Centre has come down from 4,3 per cent in 1990-91 to only 0.2 per cent in 1996-97(BE). Unfortunately, interest payments as a percentage of GDP has increased continuously from 4 per cent in 1990-91 to 4.8 per cent in 1996-97(BE). This has partly offset the efforts to reduce revenue deficit. Revenue deficit of the Central Government which was 3.5 per cent ofGDP in 1990-91 has come down by only 1 percentage point in 1996-97(BE).
1.10 In effecting fiscal correction it is imperative in the Indian context to see that the Plan budget of the Government is not adversely affected. The Plan expenditure of the Centre, which consists of budgetary support for the Central Plan and Central assistance to the States and UT Plans, accounted for 5.3 per cent of GDP in 1990-91. Except in 1993-94, when the Plan expenditure constituted 5.4 per cent ofGDP, this ratio has tended to decline over the years. In the last two years of the Eighth Plan, the Plan expenditure has come down to about 4.4 per cent of GDP. Decline in Plan expenditure has adversely affected the budget support to the Central Plan, which has come down from 3.3 per cent of GDP in 1990-91 to 2.6 per cent in 1996-97 (BE). Though marginally, the Central assistance to States and UT Plans has also been adversely affected. This has happened in spite of significant reduction in non-plan expenditure, which has come down from 14,4 per cent of GDP in 1990-91 to 12.1 per cent in 1996-97 (BE).
1.11 Within the Plan budget, there has been a compositional change of expenditure. Expenditure on economic services (budget support) which accounted for 2.6 per cent of GDP in 1990-91 declined to 1.7 per cent in 1996-97 (BE). In contrast, expenditure on social services increased from 0.7 per cent of GDP in 1990-91 to over 0.9 per cent in 1996-97 (BE). Within economic services group, there has been some shift of expenditure away from conventional sectors such as energy, transport and communication and industry and minerals to agriculture, irrigation and rural developemnt.
Inflation
1.12 The Eighth Plan envisaged that there will be a reasonable degree of price stability. It was surmised that the planned fiscal adjustment would bring down the borrowing requirements of the Government, including the borrowings from the Reserve Bank of India, which would ensure that the annual growth of money supply is brought down from about 17 per cent in the recent past to about 11 to 12 per cent during the Eighth Plan period. With income elasticity of demand for money estimated at about 1.5, and the economy planned to grow at about 5 to 6 per cent per year, it was anticipated that the projected monetary growh would enable the Government to contain the trend rate of inflation to about 5 per cent per year. In the event, none of the assumptions behind the anticipated inflation rate came true. As a consequence, average inflation rate as measured by the Wholesale Price Index (WPI) during the first four years of the plan exceeded 9 per cent. In the terminal year of the plan, the inflation rate is expected to be about 7 per cent. Thus, the average inflation rate during the Eighth Plan period would be a little less than 9 per cent, significantly higher than the projected 5 per cent.
1.13 Initially, following the stabilisation measures, the overall inflation rate on a point-to-point basis fell from 13.6 per cent in 1991-92 to 7 per cent in 1992-93. However, it accelerated to 10.8 per cent in 1993-94 and farther by 10.4 per cent in 1994-95. The annual rate of inflation during 1995-96 had shown downward trend, recording a low of about 5 per cent since January, 1996. The average inflation rate during 1995-96 was higher at 7.8 per cent. Price rise continued to be subdued at about 5 per cent during the first half of 1996-97, and has shown signs of acceleration during the second half, due to hike in administered prices of petroleum products and coal.
Balance of Payments
1.14 The current account deficit which was about $10 billion in 1990-91 has come down to about $5.5 billion in 1995-96. In some of the intervening years, it reached as low as $ 1.2 billion. As percentage of GDP, the current account deficit has declined from about 3.2 in 1990-91 to 1.7 in 1995-96. On average, during the first four years of the Eighth Plan, the current account - GDP ratio has been about 1.2 per cent and is likely to hover around 1.5 per cent for the fall five year period, almost the same as projected in the Eighth Plan document.
1.15 Improvement in the current account deficit since 1990-91 has been brought about by improved trade balance as well as improved balance of the invisibles account. Trade deficit (RBI data) as a percentage of GDP, which was 3.2 in 1990-91, had declined to about 1.6 in 1994-95, but increased significantly to about 2.7 in 1995-96. The improvement in trade deficit has been largely due to improved export performance. Exports as a percentage of GDP has successively increased from 6.2 in 1990-91 to about 10 in 1995-96. Net invisibles balance, which was negative in 1990-91, improved significantly over the years to touch 1 per cent of GDP in 1995-96.
1.16 Despite widening of the current account deficit over the last three years, the foreign exchange reserves position has remained comfortable. India's foreign exchange reserves, comprising foreign currency assets, gold reserves and SDR balances, which stood at $9.2 billion in March, 1992 increased steadily to over $25 billion in March, 1995. It declined significantly to about $21.7 billion in March, 1996. By the end of June, 1996, however, there has been a modest build-up in the reserves to a level of $22.1 billion. The movement in the reserves closely reflected the developments in the current account balance and the net capital inflows. The surge in capital inflows, especially in the form of foreign portfolio investment, helped build up substantial foreign exchange reserves since 1993-94.
1.17 The exchange rate of the Rupee remained remarkably stable during 1993-94 and 1994-95 following introduction of the market based exchanged rate regime in March, 1993. The Rupee, however, came under stress in the second half of 1995-96. An indication of widening of the current account deficit and an ebbing of capita' flows, and the pronounced appreciation of the US dollar against major currencies triggered off market expectations and resulted in depreciation of the Rupee from about Rs.31.50 in April, 1995 to about Rs. 35.60 per US dollar in October, 1995. Following intervention by the RBI, the Rupee stabilised in the range of Rs.34-36 until January, 1996. In February, 1996, the Rupee again suffered a bout of depreciation and touched a low of about Rs.38 per U.S. dollar. Following a number of measures by the RBI in early February, 1996, the Rupee staged a strong recovery in March-April, 1996 and has since remained in the range of Rs.35-36 per US dollar.
PLAN PROGRESS
FIVE YEAR PLANS
2.1 Planning in India is intended to promote a rapid rise in the standard of living of the people by efficient exploitation of the resources of the country, increasing production and offering opportunities to all for employment in the service of the community. Since 1950, seven Five Year Plans were implemented in India and the Eighth Plan commenced in 1992-93. The current year is the last year of the Plan. An Approach Document to the Ninth Five Year Plan (1997-2002) has unanimously been approved. The Ninth Five Year Plan will commence on April 1, 1997.
2.2 The preparation of Five Year Plans involves simultaneously:
(a) appraisal of the past trends and performance; (b) assessment of resources; (c) identification of major current problems; and (d) determination of measures and policies for future growth.
2.3 The preliminary exercises for preparation of a Five Year Plan starts with the consideration of the general approach to the Plan. Evaluation studies are undertaken with the help of Programme Evaluation Organisation, Central Statistical Organisation and various other institutions. The Working Groups and Steering Committees constituted by the Planning Commission for various sectors would carry out exercises to provide input for formulation of the Plan.
2.4 Discussions are held by the Planning Commission, at both expert-level and political level. The dimensions of the States' Plan are designed in consultation with individual State Chief Ministers. Simultaneously, discussions are also held with Central Ministries also, to arrive at a public investment programme which is consistent with Plan priorities, known and anticipated constraints, and resources available.
2.5 Meetings of the Internal and Full Planning Commission, from time to time, assess the progress of formulation of the Plan and also deliberate in detail on its content and scope. The Five Year Plan Document also is considered by the Union Cabinet and, thereafter, final approval is given by the National Development Council (NDC), comprising members of Union Council of Ministers and State Chief Ministers and chaired by the Prime Minister.
FORMULATION OF ANNUAL PLANS
2.6 The Five Year Plan gets operationalised through the mechanism of Annual Plans. The formulation of the Annual Plan provide the Planning Commission with an opportunity to assess previous year's Plan performance in the various sectors and to suggest a reorientation of policies and modifications of strategies consistent with the changing requirements so as to ensure achievement of the long-term objectives.
2.7 In the third quarter of each financial year, the Planning Commission indicates to the State Governments and the Central Ministries the important objectives that should be kept in view while formulating the Annual Plan for the following year and to famish their Plan proposals, including physical targets and the corresponding financial outlays required, conforming to the guidelines referred to above and within the overall framework of their respective Five Year Plans. The State Governments are advised to furnish their forecasts of financial resources, including proposals for mobilising additional resources, for their Annual Plans, keeping in view the resources and outlay targets fixed for the Five Year Plan, etc. The resource estimates of the State Governments thus furnished are discussed in-depth in a series of meetings during November-December with senior officers of the State Governments. Similarly, in-depth discussions are held with senior officials of the Central Ministries/Departments on their Annual Plan proposals, during October-December of each year.
2.8 The Plan outlays arrived at in the meetings between the Deputy Chairman and State Chief Ministers/Lt. Governors in respect of State Plans and at meetings taken by Member-Secretary, Planning Commission with the Secretaries of Central Ministries/Departments, regarding the Central Plan forms the basis of budgetary provisions for the Plan for the ensuing year.
THE EIGHTH FIVE YEAR PLAN 1992-97
2.9 The current financial year, 1996-97 is the last year of the Eighth Five Year Plan (1992-97). The Eighth Plan commenced in April, 1992 against the backdrop of overall changes taking place in the world. These changes had profound impact on both the structure of international relations and the world economy.
2.10 Recognising the relevance of developmental planning in the changed scenario ofglobalisation of the economy, it was resolved that the Planning Commission would work on building a long-term strategic vision of the future with concentration on anticipating future trends and evolving integrated strategies for the achievement of higher possible level of development of the country in keeping with competitive international standards. The Eighth Plan document was endorsed by the National Development Council (NDC) in its fourty-fourth meeting, held in May, 1992.
2.11 An attempt was made in the Eighth Plan to correct the fiscal imbalances from which the Sixth and Seventh Plan suffered. The non-inflationary manner to be adopted for funding of the Plan in order to avoid debt trap both internally and externally, called for a series of austerity measures which involved a reduction in Government's dissavings, higher resource mobilisation both by the Centre and the States and improvement in the performance of public sector units.
2.12 The Eighth Plan recognised the essential need to involve people in the process of development. The Plan envisaged substantial devolution of power to the people's organisations at the district, block and village levels. Special attention was paid to employment in the rural areas with the objective of eradicating poverty.
2.13 An average growth rate of 5.6 per cent per annum was proposed during the Plan period. The level of national investment was proposed at Rs. 7,98,000 crore.
EIGHTH PLAN (1992-97) PERFORMANCE
2.14 The overall public sector plan outlay during the Eighth Five Year Plan (1992-97) amounts to Rs. 4,34,100 crore at 1991-92 prices. The share of the Central Plan in this amount is Rs. 2,47,865 crore, or 57.1%, whereas the share of State Plans accounts for Rs. 1,79,985 crore, or 41.5%. The plans of the Union Territories account for the remaining share ofRs. 6,250 crore, or 1.4% of the overall Eighth Plan Public Sector outlay. The Plan outlays by broad heads of development for the Eighth Plan 1992-97 for Centre, States and Union Territories are given in Annexure 2.1.
2.15 A review in real terms (i.e, after allowing for inflation and assuming that the revised estimates for 1994-95 and 1995-96 and budget estimates for 1996-97 would materialise), has shown that the Plan performance in financial terms during the Eighth Plan (1992-97) accounts for about 100% of the approved Eighth Plan outlay in the Central Sector. The corresponding proportion works out to about 81% and 116%, for State Plans and UT Plans, respectively. Thus, in the case of Centre, the Plan expenditure during the Eighth Plan period (1992-97) is likely to be as envisaged. While no shortfall in the case of UT Plans is expected, major shortfalls are likely occur in the Plan provision as well as expenditure of States vis-a-vis their Eighth Plan approved outlays. A statement showing the Eighth Plan outlays and progress of expenditure during the Eighth Plan (1992-97) for Centre, States and UTs is given in Annexure 2.2. The details of overall expenditure of the Eighth Plan vis-a-vis the expenditure for Seventh Plan and two subsequent separate Annual Plans may be seen in Annexure 2.3.
Annual Plans 1992-97
2.16 For Annual Plan 1992-93, the first year of the Eighth Plan 1992-97, the actual expenditure for Centre, States and UTs amounts to Rs. 72852.44 crore which is less by Rs. 7919.52 crore (nearly 10%) than the approved outlay of Rs. 80771.96 crore. The shortfall in utilisation of outlays has been reflected both in the Central and States/UTs sectors.
2.17 The Annual Plan 1993-94 envisaged a total public sector outlay ofRs. 1,00,120.16 crore. The actual expenditure for Centre, States and UTs amounts to Rs. 88080.66 crore, which is lower by 12.03% than the Budget Estimates for the Plan. The actual expenditure for Central Plan for 1993-94 amounting to Rs. 55215.88 crore, against the budget estimates of Rs. 63936.16 crore, represents an increase of 16.6% in real terms over 1992-93, whereas in the case of States and UTs, the increase in actual expenditure in 1993-94 was only of the order of 4% over 1992-93.
2.18 The Annual Plan 1994-95 envisaged a total public sector outlay ofRs. 1,12,197.12 crore in the budget estimates, which on revision came down to Rs. 1,06,204.25 crore. Thus, the revised estimates were lower by 5.3% than the budget estimates for the Plan. While the Central Plan outlay, on revision was lower only marginally by 2.6%, the total outlay for States and UTs has come down by 9.9% in the revised estimates.
2.19 The total public sector outlay for the Annual Plan 1995-96 was fixed at Rs. 1,28,589.98 crore which on revision came down by 6.7% at Rs. 119954.33 crore. The shortfall in Centre was by 5.4%, and in the State/UT sector by 8,8%.
2.20 During these four years, the shortfall in expenditure at the Central Sector was mainly due to inadequate mobilisation of Internal and Extra Budgetary Resources (IEBR) by the Public Sector undertakings and various Ministries /Departments even after providing more budgetary support in the revised estimates.In the States sector, the reason for shortfall was lack of mobilising adequate resources due to deterioration in the balance of current revenues, erosion in the contribution of State Electricity Boards (SEBs) and State Road Transport Corporations (SRTCs), negative opening balances, mounting non-plan expenditure and shortfalls in the collection of small savings, etc.
2.21 The current year's Plan (1996-97) envisaged a total public sector outlay ofRs. 1,46,160.29 crore comprising ofRs. 87086.17 crore for the Centre, Rs. 56,347.11 crore for the States and Rs. 2727.01 crore for the Union Territories. This represents an increase of about 10.4% for the Centre and 18.5% each in the case of States and the Union Territories over the Budget estimates of 1995-96. The details of the Plan outlays for Centre, States and Union Territories are given in Annexure-2.4.
Targets and Achievements
2.22 The average growth rate ofGDP during the Eighth Plan is likely to exceed the envisaged target of 5.6 per cent. Much of this growth performance reflects the good performance of Agricultural and Industrial sectors. Though the service sector provided necessary support in achieving this growth rate, expansion of capacities in various infrastructural sub-sectors suffered setback due to lack of investments. Also, the performance in the social sector, including rural development, was not enough to meet the targets set for poverty alleviation.
(i) Infrastructure
2.23 Sustained growth of the economy depends on adequate availability of basic infrastructural facilities, such as power, transport and communications, of adequate quality. The Eighth Plan has fallen significantly short not only of its targets but also of the Seventh Plan physical achievements, in these areas. This was primarily due to the slower pace of investment in these sectors. The investment needs in this sector were of a magnitude that were beyond the resources available to the Government. Keeping in view the importance of infrastructure sector for overall economic growth, as well as for attracting private investment to make good the deficiency in Public Sector investment caused by serious resource crunch, it is necessary to protect Plan outlays of certain crucial infrastructure sub-sectors in both Centre and State Plans.
(ii) Social Sector
2.24 The programmes of direct State intervention in poverty alleviation and development of the social sectors designed during the Seventh Plan continued in the Eighth Plan also with changes in their content and scope. However, the performance of social sectors like education, health and family welfare, women and child development, housing, water supply and urban development, which depend exclusively on budgetary support for financing their Plan outlays, have shown shortfalls in expenditure as compared to the Eighth Plan targets. Shortfall in making adequate allocations for social sectors during the operational Annual Plans of the Eighth Plan occured due to severe budgetary constraints. It is imperative that the outlays in these sectors need be protected and proper utilisation of funds in the implementation of various schemes be ensured.
(iii) Employment and Regional Balance
2.25 The Eighth Plan envisaged an annual average growth rate of 2.6 per cent in employment, which was expected to generate 8 to 9 million jobs in the first half of the Plan and 9 to 10 million jobs in the second half According to the 50th round of the NSS (1993-94), the growth rate of employment between 1987-88 and 1993-94 was 2.23 per cent, falling short of the target in the first half of the Eighth Plan. As a result, while 'open' unemployment rates declined from 3.77 per cent in 1987-88 to 2.56 per cent in 1993-94, the rate of underemployment remained more or less constant at a little over 6 per cent. The States where the incidence of underemployment was over 10 per cent as per 1993-94 estimates are Goa, Kerala and Tamil Nadu. There is also evidence of deterioration ofinter-regional disparities in per capita incomes. Some of the populous and less-developed States have experienced growth rates lower than the national average. In particular, the per capita State Domestic Product declined in Bihar from Rs. 1204 in 1990-91 to Rs, 1067 in 1994-95 at 1980-81 prices, while it stagnated in Uttar Pradesh, growing at less than 0.2 per cent per annum over the period.
Resource Mobilisation
2.26 The details given above clearly bring out the fact that the shortfalls in Plan expenditure in States sector have been bigger than in the Central sector. An important reason for shortfall in States, has been their inability to raise resources for financing their plans as per commitments made at the time of Annual Plan discussions. As a result, inspite of the increase in the share of States in total budgetary support to Public Sector Plan the share of the States in the total Public Sector Plan, Outlay has come down.
2.27 It is, therefore, necessary to step up resource mobilisation efforts so as to protect the approved Plan outlays. In this regard, earnest efforts are required to improve the operational efficiency of State -level Public Enterprises, especially of the State Electricity Boards (SEBs) and State Road Transport Corporation (SRTCs) so as to derive efficiency gains from these enterprises and thereby provide the much-needed resources for financing the State Plan outlays.
2.28 In the Central sector also, there is need to ensure adequate flow of funds to infrastructure sub-sectors like power, ports etc. Also, it is necessary to improve the performance of the Central Public Sector Enterprises so as to minimise their dependence on budgetary support. Those sectors which have potential to raise their own investible resources should help increasing the share of capital expenditure in the total expenditure of the government and a substantial amount of budgetary resources, thus saved, could be invested in other priority areas, like poverty eradication and improving living standards of the people.
NINTH FIVE YEAR PLAN (1997-2002)
2.29 The Planning Commission prepared the Approach Paper to the Ninth Five Year Plan (1997-2002) based on the major policy direction given by the government in the form of "A Common Approach to Major Policy Matters and a Minimum Programme" and also taking into account the views of Chief Ministers of States, Parliamentarians, experts, specific socio-economic groups etc. The Approach Paper thus prepared has been deleberated upon in the meetings of full Planning Commission before the same was considered by the National Development Council (NDC) in its meeting held on January 16, 1997. The Approach Paper to the Ninth Five Year Plan which has been approved unanimously in the above meeting of the NDC and would form the guiding document in the preparation of the Ninth Five Year Plan.
ANNUAL PLAN (1997-98)
2.30 Annual Plan 1997-98 is the first year of the Ninth Five Year Plan. The Secretary-level discussions for formulation of the Plan with various Central Ministries/Departments have been completed by the end of January, 1997. Though the Planning Commission has completed the assessment of States' Own Resources, outlays in respect of States/Union Territories are only being finalised since exercises in this regard are in progress.
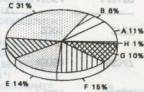
Annexure 2.1 PLAN OUTLAYS BY BROAD HEADS OF DEVELOPMENT FOR EIGHTH PLAN 1992-97 (Rs. crore)
| CENTRE | STATES/UTs | TOTAL | |||||
| Outlay | % age to total | Outlay | % age to total | Outlay | % age to total | Outlay | %age to total |
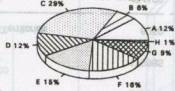
| 1. | Agriculture and Allied Services(") | 12618 | 5.09 | 42375 | 22.75 | 54993 | 12.67 |
| 2. | Rural Development | 24170 | 9.75 | 10255 | 5.51 | 34425 | 7.93 |
| 3. | Energy | 66795 | 26.95 | 48766 | 26.19 | 115561 | 26.62 |
| 4. | Industry and Minerals | 37539 | 15.14 | 9383 | 5.04 | 46922 | 10.81 |
| 5. | Transport | 40977 | 16.53 | 14949 | 8.03 | 55926 | 12.88 |
| 6. | Social Services | 34445 | 13.90 | 44566 | 23.93 | 79012 | 18.20 |
| 7. | Others($) | 31321 | 12.64 | 9191 | 4.94 | 40512 | 9.33 |
| 8. | Area Programmes | 6750 | 3.62 | 6750 | 1.55 | ||
| GRAND TOTAL | 247865 | 100.00 | 186235 | 100.00 | 434100 | 100.00 | |
* Include Agriculture
and Irrigation Sectors.
$ Include Communications, Science, Technology and Environment, General
Economic Services and General Services.
PLAN OUTLAY BY
BROAD HEADS OF DEVELOPMENT EIGHTH PLAN 1992-97
Rs. 4341 00 Crore
 |
 |
#
AGRI and SERVICES INCLUDES AGRICULTURAL and ALLIED SERVICES and
IRRIGATION AND FLOOD CONTROL
• OTHERS INCLUDE COMMUNICATIONS. SCIENCE, TECHNOLOGY and ENVIRONMENT,
GENERAL ECONOMIC SERVICES and GENERAL SERVICES
PLAN OUTLAY BY BROAD HEADS OF DEVELOPMENT Eighth Plan 1992-97 (in Rs. Crore)
I#
AGRI and SERVICES INCLUDES AGRICULTURAL AND ALLIED SERVICES AND IRRIGATION
AND FLOOD CONTROL
• OTHERS INCLUDE COMMUNICATIONS, SCIENCE, TECHNOLOGY AND ENVIRONMENT,
GENERAL ECONOMIC SERVICES and GENERAL SERVICES
Annexure - 2.2 EIGHTH PLAN OUTLAY AND PROGRESS OF EXPENDITURE: CENTRE,STATES and UTs. (Rs. in crores)
SECTOR |
Eighth
Plan (1992-97) Outlay at 1991-92 prices |
ANNUAL PLAN AT CURRENT PRICES |
||||
| 1992-93 | 1993-94 | 1994-95 | 1995-96 | 1996-97 | ||
| Actual Expend. | Actual Expend. | Revised Estimates | Revised Estimates | Budget Estimates | ||
| 1 | 2 | 3 | 4 | 5 | 6 | 7 |
| Centre | 247865 | 43694 | 55216 | 68316 | 74594 | 87086 |
| States | 179985 | 27917 | 31501 | 35825 | 43059 | 56347 |
| Union Territories | 6250 | 1242 | 1364 | 2063 | 2301 | 2727 |
| TOTAL | 434100 | 72853 | 88081 | 106204 | 119954 | 146160 |
PLAN
OUTLAY BY BROAD HEADS OF DEVELOPMENT Annual
Plans
1992-93 - Rs. 80771.96 Crore; 1993-94 - Rs. 100120.16 Crore
 |
 |
|
1994-95 |
|
1995-96 |
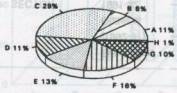 |
1996-97
|
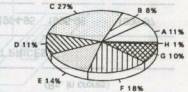 |
I#
AGRI and SERVICES INCLUDES AGRICULTURAL AND ALLIED SERVICES AND IRRIGATION
AND FLOOD CONTROL
• OTHERS INCLUDE COMMUNICATIONS, SCIENCE, TECHNOLOGY AND ENVIRONMENT,
GENERAL ECONOMIC SERVICES and GENERAL SERVICES
Annexure 2.3 PUBLIC SECTOR PLAN EXPENDITURE FOR CENTRE, STATES and UNION TERRITORIES (Rs. crores)
| SECTOR | 7th Plan 1965-90 Expend. at current prices | Annual Plans 1990-92 Expend. at current prices | Eighth Plan Outlay 1992-97 at 1991-92 prices | 5 Years 1992-97 Anti. Exp. at current prices (•) | 5 Years 1992-97 Anti. Exp. at 1991-92 prices (•) | 1992-97 Exp. at 1991-92 prices as %age of 8th Plan |
| 1 | 2 | 3 | 4 | 5 | 6 | 7 |
| CENTRE | 127520 (58.3%) |
73101 (58.9%) |
247865 (57.1%) |
328906 (61.7%) |
247891 (61.7%) |
100.0% |
| STATES | 87493 (40.0%) |
48856 (39.4%) |
179985 (41.5%) |
194649 (36.5%) |
146493 (36.5%) |
81.4% |
| UNION TERRITORIES | 3718 (1.7%) |
2163 (1.7%) |
6250 (1.4%) |
9697 (1.8%) |
7257 (1.8%) |
116.1% |
| GRAND TOTAL | 218731 | 124120 | 434100 | 533252 | 401641 | 92.5% |
Figures in brackets indicate percentage share over total. (*): Includes Actuate for 1992-93 and 1993-94; RE for 1994-95 and 1995-96 and BE for 1996-97.
Annexure 2.4 PLAN OUTLAY BY BROAD HEADS OF DEVELOPMENT FOR ANNUAL PLAN 1996-97 (Rs. in crores)
| SL. No. | Heads of Development | CENTRE | STATES/UTs | TOTAL | |||
| Outlay | % age to total | Outlay | % age to total | Outlay | % age to total | ||
| 1. | Agriculture and Allied Services (•) | 4078.20 | 4.68 | ||||
| 2. | Rural Development | 5394.10 | 6.19 | ||||
| 3. | Energy | 24270.51 | 27.87 | ||||
| 4. | Industry and Minerals | 11826.23 | 13.58 | ||||
| 5. | Transport | 15972.39 | 18.34 | ||||
| 6. | Social Services | 12704.77 | 14.59 | ||||
| 7. | Others ($) | 12839.97 | 14,74 | ||||
| 8. | Area Programmes | ||||||
| GRAND TOTAL | 87086.17 | 100.00 | 59074.12 | (##) | 146160.29 | ||
* Include Agriculture
and Irrigation Sectors.
$ Include
Communications, Science, Technology and Environment, General Economic
Services and General Services.
##Heads of Development-wise break-up of State/UT sector outlays are not
yet available.


