Annual Report 1997-1998
Introduction
1.1 The year 1997 witnessed the culmination of the Eighth Five Year Plan and the beginning of the Ninth Plan period. It is in the light of this that stock can now be taken of the achievements during the Eighth Plan period in relation to the targets s'et.
1.2 The Eighth Five Year Plan (1992-97), was launched keeping in mind the necessity of implementing measures for stabilization and structural adjustment subsequent to the Balance of Payments (BOP) crisis of 1991. The Plan took into account the changes that were to be expected in the economy on account of the adoption of these reform measures, while keeping in mind the poor performance of the economy in the base year,1991-92. In the base year the rate of inflation was in double digits, while the overall growth rate of GDP for that year was negligible. The BOP situation improved somewhat with a mild improvement in the foreign exchange reserves, while exports continued to be sluggish. It is in the light of these circumstances that the Eighth Five Year Plan set down macroeconomic targets which were somewhat cautious in comparison to the feasible. The targets fixed for the Plan included a rate of growth in GDP of 5.6 per cent, an average industrial growth rate of 7.5 per cent, a savings rate of 21.6 per cent, an investment rate of 23.2 per cent, a current account deficit (CAD) of 1.6 per cent as a percentage of GDP among others.
1.3 The Approach Paper to the Ninth Five Year Plan was prepared and presented to the National Development Council (NDC) in December 1996. It envisaged a base-line growth scenario of 6.2 per cent per annum on the average for the Ninth Plan period. It was also indicated that an accelerated growth scenario of 7 per cent per annum was feasible provided certain policy decisions were adopted by the Centre and the States. In its meeting held on January 16, 1997, the NDC approved the Approach Paper and directed the Planning Commission to formulate the Ninth Five Year Plan on the basis of the accelerated growth scenario of 7 per cent. The Draft Ninth Five Year Plan was prepared by the Planning Commission on the basis of the approved Approach Paper, but it could not be put up to the NDC for approval due to the imminent change in government.
1.4 The Draft Ninth Five Year Plan seeks to further continue and consolidate the process of reforms. The targets set therein include a GDP growth rate of 7 per cent, an investment rate of 28.3 per cent, a savings rate of 26.2 per cent and a CAD to GDP ratio of 2.1.
Growth and Sectoral Output
1.5 The first year of the economic reforms and also the base year of the Eighth Plan, 1991-92, had a GDP growth rate of less than one percent as compared to an average annual growth rate of 6 per cent during the Seventh Plan period. As the economy gradually absorbed the initial shock of the stabilisation measures, the GDP growth rates recovered over the years from 5.3 per cent in 1992-93 to 6 per cent in 1993-94, 7.2 per cent in 1994-95 as well as in 1995-96, and in 1996-97 stood at 7.5 per cent as per the latest estimates from CSO. Thus the average GDP growth rate during the Eighth Plan period was 6.64 per cent which is well above the targeted rate of 5.6 per cent, indicating a satisfactory performance in this front. The Advance Estimates indicate that the rate of growth in GDP in 1997-98 is likely to be about 5 per cent.
1.6 The good performance of the economy reflects in large measure the successive good performance of the Agricultural sector. After recording a decline of 2,3 per cent in 1991-92, agricultural GDP increased at an average growth rate of 3.96 per cent during the Eighth Plan period as per latest data available. Although there was a decline of 3.4 per cent in 1995-96, agricultural GDP recovered to a growth rate of 8.2 per cent in 1996-97 (at 1980-81 prices). Foodgrains production increased steadily from 168 million tonnes in 1991-92 to about 191.5 million tonnes in 1994-95, 185 million tonnes in 1995-96, and 198.2 million tonnes is expected in 1996-97. Overall the growth of Agricultural GDP during the Eighth Plan was 3.96 per cent which is well above the targetted growth rate of 3.1 per cent.
1.7 On the industrial front, all the major industry segments witnessed severe recession during 1991-92. 'The index of industrial production grew by less than 1 per cent in 1991-92, but picked up momentum from 1993-94 with a growth rate of 5.98 per cent, increasing to 9.35 per cent in 1994-95, and further to 12.14 per cent in 1995-96 but then fell to 7.28 per cent in 1996-97. The average industrial growth during the Eighth Plan period was 7.4 per cent, which is only marginally less than the target rate of 7.5 per cent. The index of manufacturing production grew consistently from 3.5 per cent in 1992-93 to 16.1 per cent in 1995-96 but declined to 6.8 per cent in 1996-97, to give an average growth rate of 9.1 per cent for the Eighth Plan period. The Advance Estimates indicate that the manufacturing sector is likely to grow by 6.4 per cent in 1997-98.
1.8 The performance of the Service sector during the Eighth Plan period was quite good, showing an average growth rate of 8.9 per cent during the Eighth Plan period, which exceeds the target rate of 6,2 per cent. The Service sector consists of trade, transport, communication, finance, insurance and community and social services. The sectors which mainly contributed to this good performance are Trade, hotels and restaurants, with an average growth rate of 10 per cent during the Plan period, followed by Financing, insurance, real estate and business services with an average growth rate of 9 per cent during the Plan period.
Savings and Investment
1.9 Gross Domestic Saving as a proportion of GDP, averaged 24.32 per cent during the Eighth Plan period against a target level of 21.6 per cent. The improvement in the savings rate was made possible by a steady increase in the private corporate and the household savings rate during the Plan period. The average corporate savings rate and the average household savings rate was 3.7 per cent and 19 per cent respectively in the Plan period.
1.10 Gross Domestic Investment as a proportion of GDP, averaged 25.6 per cent as against a targetted rate of 23.2 per cent. The investment rate got a boost in 1994-95 to 26 per cent due to a higher savings rate of 24.9 per cent in 1994-95 and a CAD of about 1 per cent of GDP. The savings rate in 1996-97 is expected to be 26.1 per cent of GDP, with the CAD expected to be about Iper cent of GDP. Thus the investment rate is likely to improve further in 1997-98.
Fiscal Developments
1.11 The Eighth Plan Document stated that a major aim of fiscal policy should be to roll back the fiscal deficit of the centra/and States, taken together as a percentage of GDP, from an average of 10.6 per cent during the Seventh Plan, and from about 11 per cent in 1990-91, to an average of about 7 per cent during the Eighth Plan period. This implicitly meant that the Centre's fiscal deficit would be required to be brought down to an average of 5 per cent and that of the States to an average of about 2 per cent during the Eighth Plan period. However despite concious efforts, the fiscal deficit to GDP rate of the Centre was about 6 per cent and that of the States was about 3 per cent during the Eighth Plan period. Although the Centre's fiscal deficit of 6 per cent seems high, over the years it has actually decreased from around 8.3 per cent in 1990-91 to 5 per cent in 1996-97 and is expected to be about 4.5 per cent in 1997-98 (BE) (according to the RBI Annual Report 19°' 7). The Primary deficit of the Centre as a percentage of GDP has come down from 4.3 per cent in 1990-91 to 0.37 per cent in 1996-97 (RE) and is expected to be -0.18 per cent in 1997-98 (BE). Unfortunately interest payments as a percentage of GDP has increased continuously from 4 per cent in 1990-91 to 4.6 per cent in 1996-97, and on an average was 4.5 per cent for the Eighth Plan period. This has partly offset the efforts to further reduce the revenue deficit. Revenue deficit of the Central Government which was 3.5 per cent of GDP in 1990-91 has come down to about 2 per cent in 1996-97 (RE) and is likely to be about 2.08 per cent in 1997-98 (BE).
Inflation
1.12 The Eighth Plan envisaged that there will be a reasonable degree of price stability. It was surmised that the planned fiscal adjustment would bring down the borrowing requirements of the Government, including the borrowings from the RBI, which would ensure that the annual growth rate of money supply is brought down from about 17 per cent in the recent past to about 11-12 per cent in the Eighth Plan period. With income elasticity of demand for money estimated at about 1.5, and the economy planned to grow at about 5 to 6 per cent per year, it was anticipated that the projected monetary growth would enable the Government to contain the trend rate of inflation to about 5 per cent per year. The average inflation rate as measured by the Wholesale Price Index (WP1) during the 8th five year plan was about 8.7 per cent. In the terminal year of the plan, the inflation rate is expected to be about 6.4 per cent. Thus, the average inflation rate during the Eighth Plan period was about 8.7 per cent, significantly higher than the projected 5 per cent.
1.13 Initially, following the stabilisation measures, the overall inflation rate on a point-to-point basis fell from 13.6 per cent in 1991-92 to 7 percent in 1992-93. However, it accelerated to 10.8 per cent in 1993-94 and to 10.4 per cent in 1994-95. The annual rate of inflation during 1995-96 has shown a downward trend recording a low of about 5 per cent since January, 1996 and is 6.9 per cent in 1996-97. Price rise continued to be subdued at about 5 per cent during the first half of 1996-97, but showed signs of acceleration during the second half, due to a hike in administered prices of petroleum products and coal.
Balance of Payments
1.14 The current account deficit which was about $10 billion in 1990-91 has come down to about $5,9 billion in 1995-96 and $3.7 billion in 1996-97. As percentage of GDP, the current account deficit has declined from about 3.2 per cent in 1990-91 to 1.8 in 1995-96 and 1 per cent in 1996-97. On an average, in the Eighth Plan, the current account to GDP ratio has been about 1.2 per cent as against a targetted rate of 1.6 percent. Trade deficit (RBI data) as a percentage of GDP, which was 3.2 per cent in 1990-91, had fallen to about 1.6 in 1993-94 but increased significantly to about 3.4 per cent in 1995-96 and to 3.45 per cent in 1996-97.
1.15 Exports as a percentage of GDP has successively increased from 6.2 in 1990-91 to about 10 per cent in 1995-96 and 9.5 per cent in 1996-97. Net invisibles balance which was negative in 1990-91, improved significantly over the years to touch 1.65 per cent of GDP in 1995-96 and 2.41 per cent in 1996-97.
1.16 Despite widening of the current account deficit over the last three years, the foreign exchange reserves position has remained comfortable. India's foreign exchange reserves comprising of foreign currency assets, gold reserves and SDR balances, which stood at $ 9.2 billion in March 1992 and increased steadily to over $25 billion in March 1995. Although the foreign exchange reserves declined in 1995-96 to $21.7 billion, it stood at $26.4 billion in 1996-97. The movement in the reserves closely reflected the developments in the current account balance and the net capital inflows. The surge in capital inflows specially in the form of foreign portfolio investment helped build up substantial foreign exchange reserves since 1993-94.
1.17 The exchange rate of the rupee remained remarkably stable during 1993-94 and 1994-95 following the introduction of the market based exchange rate regime in March 1993. The Rupee however came under stress in the second half of 1995-96. An indication of the widening of the current account deficit and an ebbing of capital flows and the pronounced appreciation of the US dollar against major currencies triggered off market expectations and resulted in depreciation of the Rupee from about Rs. 31.50 in April, 1995 to about Rs. 35.60 per dollar in October, 1995. Following intervention by the R.B.I, the rupee stabilised in the range of Rupees 34 to 36 until January, 1996. In February, 1996, the rupee again suffered a bout of depreciation and touched a low of about Rs.38 per U.S. dollar. Following a number of measures by the R.B.I, in early February, 1996, the Rupee staged a strong recovery. In March- April, 1996 and has since remained in the range of Rs.35-36 per U.S. dollar. It stood at Rs.35.96 in 1996-97 as per the R.B.I. Annual Report 1996-97.
PLAN PROGRESS
Five Year Plans
2.1 Planning in India was intended, in the words of the resolution of March, 1950 "to promote a rapid rise in the standard of living of the people by efficient exploitation of the resources of the country, increasing production and offering opportunities to all for employment in the service of the community." Since 1950, eight Five Year Plans have been implemented in India. The Approach Paper to the Ninth Five Year Plan was unanimously approved by the National Development Council in its meeting held on 16.01.1997.
2.2 The preparation of Five Year Plans involves simultaneously :
(a) appraisal of the past trends and performance; (b) assessment of resources; (c) identification of major problems; and (d) determination of measures and policies for future growth. The National Plan comprises of the Central and State Governments' Plans as well as Plans for the private sector more especially for the corporate sector.
2.3 The preliminary exercises for preparation of a Five Year Plan start with the consideration of the general approach to the Plan. Evaluation studies are undertaken with the help of Programme Evaluation Organisation, Central Statistical Organisation and various other institutions. The Working Groups and Steering Committees constituted by the Planning Commission for various sectors carry out exercises to provide input for formulation of the Plan.
2.4 Discussions are held by the Planning Commission, at both expert-level and political level. The dimensions of the States' Plan are designed in consultation with individual State Chief Ministers. Simultaneously, discussions are also held with Central Ministries, to arrive at a public investment programme which is consistent with Plan priorities, known and anticipated constraints, and resources available.
2.5 Meetings of the Internal and Full Planning Commission, from time to time, assess the progress of formulation of the Plan and also deliberate in detail on its content and scope. The Five Year Plan Document also is considered by the Union Cabinet, thereafter, final approval is given by the National Development Council (NDC), comprising members of Union Council of Ministers and State Chief Ministers and chaired by the Prime Minister.
Formulation of Annual Plans
2.6 ' The Five Year Plan gets operationalised through the mechanism of Annual Plans. The formulation of the Annual Plan provide the Planning Commission with an opportunity to assess previous year's Plan performance in the various sectors and to suggest a reorientation of policies and modifications of strategies consistent with the changing requirements so as to ensure achievement of the long-term objectives.
2.7 In the third quarter of each financial year, the Planning Commission indicates to the State Governments and the Central Ministries the important objectives that should be kept in view while formulating the Annual Plan for the following year and to furnish their Plan proposals, including physical targets and the corresponding financial outlays required, conforming to the guidelines referred to above and within the overall framework of their respective Five Year Plans. The State Governments are advised to furnish their forecasts of financial resources, including proposals for mobilising additional resources, for their Annual Plans, keeping in view the resources and outlay targets fixed for the Five Year Plan, etc. The resource estimates of the State Governments thus furnished are discussed in-depth in a series of meetings during November-December with senior officers of the State Governments. Similarly, in-depth discussions are held with senior officials of the Central Ministries/Departments on their Annual Plan proposals, during October-December of each year.
2.8 The Plan outlays arrived at in the meetings between the Deputy Chairman and State Chief Ministers/Lt. Governors in respect of State Plans and at meetings taken by Member Secretary, Planning Commission with the Secretaries of Central Ministries/Departments, regarding the Central Plan forms the basis for budgetary provisions for the Plan for the ensuing year.
Eighth Five Year Plan (1992-97)
2.9 The Eighth Plan commenced in April, 1992 against the backdrop of overall changes taking place in the world. These changes had profound impact on both the structure of international relations and the world economy.
2.10 Recognising the relevance of developmental planning in the changed scenario of globalisation of the economy, it was resolved that the Planning Commission would work on building a long-term strategic vision of the future with concentration on anticipating future trends and evolving integrated strategies for the achievement of higher possible level of development of the country in keeping with competitive international standards. The Eighth Plan document was endorsed by the National Development Council (NDC) in its forty-fourth meeting, held in May, 1992.
2.11 An attempt was made in the Eighth Plan to correct the fiscal imbalances from which the Sixth and Seventh Plan suffered. The non-inflationary manner to be adopted for funding of the Plan in order to avoid debt trap both internally and externally, called for a series of austerity measures which involved a reduction in Government's dissavings, higher resource mobilization both by the Centre and the States and improvement in the performance of public sector units .
2.12 The Eighth Plan recognised the essential need to involve people in the process of development. The Plan envisaged substantial devolution of power to the people's organisations at the district, block and village levels. Special attention was paid to employment in the rural areas with the objective of eradicating poverty.
2.13 An average growth rate of 5.6 per cent per annum was proposed during the Plan period. The level of national investment was proposed at Rs. 7,98,000 crore.
Eighth Plan (1992-97) Performance
2.14 The overall public sector plan outlay during the Eighth Five Year Plan (1992-97) amounts to Rs. 4,34,100 crore at 1991-92 prices. The share of the Central Plan in this amount is Rs. 2,47,865 crore, or 57.1%, whereas the share of State Plans accounts for Rs. 1,79,985 crore, or 41.5%. The Plans of the Union Territories account for the remaining share of Rs. 6,250 crore, or 1.4% of the overall Eighth Plan Public Sector outlay. The Plan outlays by broad heads of development for the Eighth Plan 1992-97 for Centre, States and Union Territories are given in Annexure 2.1.
2.15 A review in real terms (i.e., after allowing for inflation and assuming that the revised estimates for 1995-96 and 1996-97 would materialise), has shown that the Plan performance in financial terms during the Eighth Plan (1992-97) accounts for about 95% of the approved Eighth Plan outlay in the Central Sector. The corresponding proportion works out to about 80% and 109% for State Plans and UT Plans, respectively. Thus, in the case of Centre, the short fall in anticipated Plan expenditure during the Eighth Plan period has been marginal vis-a-vis the approved Eighth Plan outlay. Whereas there is no shortfall in the case of UT Plans, major shortfalls were likely to occur in the Plan provision as well as expenditure of States vis-a-vis their Eighth Plan approved outlays. The reason for shortfall was lack of mobilising adequate resources due to deterioration in the balance of current revenues, erosion in the contribution of State Electricity Boards (SEBs) and State Road Transport Corporations (SRTCs), negative opening balances, mounting non-Plan expenditure and shortfalls in the collection of small savings, etc. A statement showing the Eighth Plan outlays and progress of expenditure during the Eighth Plan (1992-97) for Centre, States and UTs is given in Annexure 2.2.
Annual Plan (1997-98)
2.16 The total public sector outlay for the Annual Plan 1997-98 has been fixed at Rs. 155750.89 crore. This represents an increase of 7.68 per cent over the approved outlay of Rs. 144635.87 crore for the Annual Plan 1996-97. The Plan aims at strengthening and providing support to the important programmes/projects/schemes in the States' Sector as well as in the Central Sector. The details of the Plan outlays by broad heads of development for centre, States and Union Territories for the Annual Plan, 1997-98 are given in Annexure-2.3.
Annual Plan (1998-99)
2.17 For the purpose of Vote on Account, the Central Ministries/Departments were requested to formulate plan proposal keeping the level of Gross Budget Support (GBS) at the same level as in 1997-98. Before this, Special Secretary had written to Finance Secretary enclosing the estimates or resources for the Annual Plan 1998-99 on November, 1997.
Annual Plan Document
2.18 During the year under report, the Annual Plan 1996-97 document was released and was subsequently placed in the Parliament Library.
2.19 The Eighth Five Year Plan had set the target of 5.6 per cent per annum during the Five Year period (1992-97). The growth recorded in the Gross Domestic Product was of the order of 5.3 per cent in 1992-93, 6.0 per cent in 1993-94 and 7.2 per cent during 1994-95, as well as in 1995-96 and 7.5 per cent in 1996-97 as per the latest estimates from CSO.
Preparation of the Ninth Five Year Plan (1997-2002)
2,20 As a first step for the formulation of Ninth Five Year Plan (1997-2002), Planning Commission had set up a number of Steering Committees and Working Groups dealing with various sectors. These Steering Committees and Working Groups comprised of experts in the respective areas and undertook detailed exercises and submitted reports which formed the major input in the formulation of the draft Ninth Five Year Plan. In ail, 23 Steering Committees and 116 Working Groups were set up for the Ninth Five Year Plan.
2.21 The Approach Paper to the Ninth Five Year Plan, approved unanimously by the National Development Council (NDC) in its meeting held on 16.01.1997 inter-ail includes the following salient features:
2.22 The objectives of the Ninth Plan arising from the Common Minimum Programme of the Government, the Chief Ministers' Conference on Basic Minimum Services and the suggestions put forward by the Chief Ministers of various States during extensive consultation have been spelt out in the Approach to the Ninth Five Year Plan document. "Growth with Equity" is proposed be achieved with the objectives outlined in the Approach Papt These are to be viewed in the context of the four importai.i dimensions of State policy viz., (a) quality of life of the citizens; (b) generation of productive employment; (c) regional balance; and (d) self-reliance.
2.23 The Approach Paper projected a 7% annual GDP growth scenario, with necessary targets of Domestic Savings Rate, Current Account Deficit, Incremental Capital Output Ratio, Investment Rate and total Public Sector Plan size ofRs. 8,75,000 crore.
2.24 The Internal Planning Commission undertook the exercise of working out the details of the Ninth Plan, within the framework of the Approach Paper adopted by the National Development Council. The draft Ninth Five Year Plan (1997-2002) (Volume I and II) prepared at the meetings of the Internal Planning Commission was released by the then Deputy Chairman, Planning Commission on 01.03.1998.
Decentralisation in Plan Formulation
2.25 In order to operational ise the concept of decentralised planning, assistance is provided to the States under the scheme of strengthening of planning machinery at State and district levels. For the Ninth Plan, new guidelines have been issued for the scheme. In keeping with the changed scenario consequent on the enactment of 73rd and 74th Amendment Act, States have been asked to set up/strengthen a cell for Panchayati Raj Institutions in the apex of planning bodies of the State Government. At the district level the existing scheme will continue. The guidelines allow the hiring of consultants for preparation of specific studies relating to Panchayati Raj Institutions and the planning process for preparation of district level plans.
2.26 Keeping the NDC's decisions in view, during the Ninth Plan and the Annual Plan (1997-98) discussions, the State Governments were impressed upon the need to allocate more untied funds to the PRIs and ULBs so as to enable them to formulate and implement developmental programmes as per the local requirements. As an effort to achieve the objective of improving the quality of life of the people, enhanced level of Additional Central Assistance was provided to the States for providing seven identified Basic Minimum Services and for Slum Development during the Annual Plan 1997-98. States have full flexibility to take up schemes within these services according to their requirements and needs.
Annexure 2.1: PLAN OUTLAY BY BROAD HEADS OF DEVELOPMENT FOR EIGHTH PLAN ( 1992-97) (Rs. crore)
| Sl. No | Heads of Development | CENTRE |
STATES and UTs |
TOTAL |
|||
| Outlay | %-age to total | Outlay | %-age to total | Outlay | %- age to total | ||
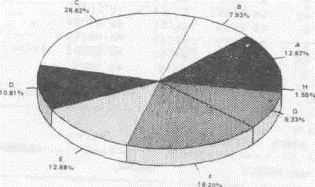
| 1 | Agriculture and Allied Services ($) | 12618.00 | 5.09 | 42374.50 | 22.75 | 54992.50 | 12.67 |
| 2 | Rural Development | 24170.00 | 9.75 | 10255.36 | 5.51 | 34425.36 | 7. 93 |
| 3 | Energy | 66795.00 | 26. 95 | 48766.09 | 26.19 | 115561.09 | 26.62 |
| 4 | Industry and Minerals | 37539.00 | 15.14 | 9382.75 | 5.04 | 46921.75 | 10.81 |
| 5 | Transport | 40977.00 | 16.53 | 14948.57 | 8.03 | 55925.57 | 12.88 |
| 6 | Social Services | 34445.45 | 13.90 | 44566.45 | 23.93 | 19011.90 | 18.20 |
| 7 | Others (*) | 31320.55 | 12. 64 | 9191.12 | 4.94 | 40511.67 | 9.33 |
| 8 | Area Programnes | 6750.16 | 3.62 | 6750.16 | 1.56 | ||
| GRAND TOTAL | 247865.00 | 100.00 | 186235.00 | 100.00 | 434100.00 | 100.00 | |
($) Include Agriculture
and Irrigation sectors.
(*) Include Communications, Science Technology and Environment, General
Economic Services and General Services.
Annexure 2.2 EIGHTH PLAN OUTLAY AND PROGRESS OF EXPENDITURE : CENTRE, STATES and UTs. (Rs. Crore)
| Sl. No | Sector | Eighth
Plan Outlay at 1991-92 prices |
Annual Plan at 1991-92 Prices |
Anticipated Expenditure Eighth Plan (1992-97) |
||||
| 1992-93 Actual Exp. |
1993-94 Actual Exp. |
1994-95 Actual Exp. |
1995-96 R.E. |
1996-97 R.E. |
||||
| 1 | 2 | 3 | 4 | 5 | 6 | 7 | B | 9 |
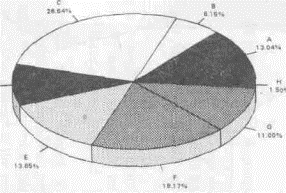
| 1 | Centre | 247865 | 39903 | 46517 | 44823 | 52424 | 50915 | 234582 (94.6) |
| 2 | States | 179985 | 25495 | 26538 | 28432 | 30261 | 33118 | 143844 (79.9) |
| 3 | Union Territories | 6250 | 1134 | 1149 | 1256 | 1617 | 1678 | 6834 (109.3) |
| Total | 434100 | 66532 | 74204 | 74511 | 84302 | 85711 | 385260 (88.8) |
|
Note : Figures in brackets indicate as percentage of the Eighth Plan Outlay.
Annexure 2.3 PLAN OUTLAY BY BROAD HEADS OF DEVELOPMENT FOR ANNUAL PLAN ( 1997-98) (Rs. crore)
| Sl.No. | Heads of Development | CENTRE | STATES/UTs @ | TOTAL @ | |||
| Outlay | %-age to total | Outlay | %-age to total | Outlay | %-age to total | ||
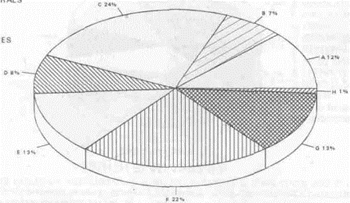
| 1 | Agriculture and Allied Services ($) | 3292.23 | 3.58 | 14908.74 | 23.33 | 18200.97 | 11.69 |
| 2 | Rural Development | 5800.75 | 6.32 | 5449.41 | 8.53 | 11250.16 | 7.22 |
| 3 | Energy | 24234.53 | 26.39 | 12878.99 | 20.15 | 37113.52 | 23.83 |
| 4 | Industry and Minerals | 11199.80 | .12.20 | 2119.30 | 3.31 | 13319.10 | 8.55 |
| 5 | Transport | 15015.96 | 16.35 | 5573.61 | 8.72 | 20589.57 | 13.22 |
| 6 | Social Services | 15707.01 | 17.10 | 18514.50 | 28.97 | 34221.51 | 21.97 |
| 7 | Others (*) | 16588.43 | 18.06 | 3686.78 | 5.77 | 20275.21 | 13.02 |
| 8 | Area Programmes | 0.00 | 0.00 | 780.85 | 1.22 | 780.85 | 0.50 |
| GRAND TOTAL | 91838.71 | 100.00 | 63912.18 | 100.00 | 155750.89 | 100.00 | |
($)
Include Agriculture and Irrigation sectors. (*) Include Communications,
Science Technology and Environment, General Economic Services and General
Services.
@ Provisional
PLANOUTLAYS
BROAD HEADS OF DEVELOPMENT EIGHTH PLAN 1992-97
Rs. 434100 Crore
 |
 |
#
AGRI and SERVICES INCLUDES AGRICULTURAL and ALLIED SERVICES and
IRRIGATION AND FLOOD CONTROL
* OTHERS INCLUDE COMMUNICATIONS, SCIENCE, TECHNOLOGY and ENVIRONMENT,
GENERAL ECONOMIC SERVICES and GENERAL SERVICES
ANTICIPATED EXPENDITURE
BY BROAD HEADS OF DEVELOPMENT EIGHTH PLAN 1992-97
Rs. 385260 Crore
 |
|
#
AGRI and SERVICES INCLUDES AGRICULTURAL and ALLIED SERVICES and
IRRIGATION AND FLOOD CONTROL
* OTHERS INCLUDE COMMUNICATIONS, SCIENCE, TECHNOLOGY and ENVIRONMENT,
GENERAL ECONOMIC SERVICES and GENERAL SERVICES
PLAN OUTLAY BY
BROAD HEADS OF DEVELOPMENT Annual Plan 1997-98
Rs. 155750.89 Crore
 |
|
#
AGRI and SERVICES INCLUDES AGRICULTURAL and ALLIED SERVICES and
IRRIGATION AND FLOOD CONTROL
* OTHERS INCLUDE COMMUNICATIONS, SCIENCE, TECHNOLOGY and ENVIRONMENT,
GENERAL ECONOMIC SERVICES and GENERAL SERVICES


