Annual
Report on the Working of
State Electricity Boards and Electricity Department, April 1999
Power and
Energy Division, Planning Commission
Synopsis
This
is a comprehensive report on the working of State Electricity Boards (SEB).
It provides insight into SEB’s performance by analysing various performance
parameters and bringing to the fore major issues concerning the power
sector. The credit for bringing out this annual report, eleventh in the
series, goes to the Power and Energy Division
of the Planning Commission.
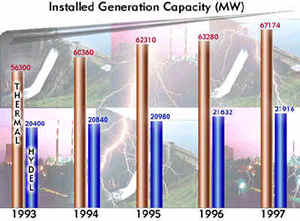
- Total installed
capacity of the electricity supply undertakings in the country increased
from 84,912.4 MW at the end of March, 1997, to 89,090 MW as on March
31, 1998.
- Hydel capacity
in the country has almost remained static over the years and is 21,891.1
MW as on March 31, 1998, constituting 24.6 per cent share in the total
installed capacity.
- On the other hand,
thermal capacity has more than doubled from 31,300 MW in 1985 to 66,230.8
MW as on March 31, 1998 constituting 74.3 per cent share in the total
installed capacity.
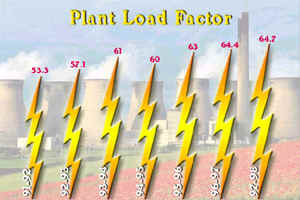
- A marked
improvement in plant load factor (PLF) from 60 per cent in 1994-95 to
64.7 per cent in 1997-98
- As a result of
the improvement in PLF, energy shortages has declined from 11.5 per
cent during 1996-97 to 8.1 per cent during 1997-98 and peak deficit
has declined from 18 per cent during 1996-97 to 11.3 per cent during
1997-98.
- Inter-state disparities
still persists. While Bihar SEB recorded the lowest PLF of 16.10 per
cent, Andhra Pradesh SEB recorded the highest PLF of 82.0 per cent during
1997-98.
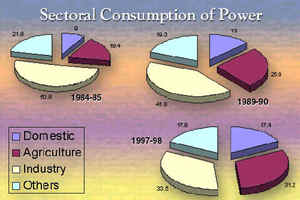
- The sales of electricity
increased from 213 Bkwh in 1992-93 to 293 Bkwh in 1997-98 representing
annual growth rate of 6.6 per cent.
- Primarily due to
an increase in captive power units in the industrial sector, the share
of industrial sector in the total power sales has declined from 50 per
cent in 1984-85 to 33.5 per cent in 1997-98.
- On the other hand,
share of domestic and agriculture sectors in the total sales increased
from 27.4 per cent in 1984-85 to nearly 48.6 per cent in 1997-98.
- This increase in
share of domestic and agriculture sector in total sales has partly led
to an increase in effective subsidy to these sectors to Rs. 22,216 crore
in 1997-98 from Rs .5,651 crore in 1990-91.
- The per capita
electricity consumption increased from 178 Kwh in 1985-86 to 338 Kwh
in 1996-97 registering an annual growth rate of 6.5 per cent.
- The lowest per
capita consumption has been recorded in the north-eastern states like
Nagaland, Tripura and Arunachal Pradesh with per capita consumption
of 88 Kwh, 80 Kwh and 81 Kwh respectively.
- Transmission and
distribution (T and D) losses have increased marginally in absolute
terms from 81,741.2 Mkwh during 1996-97 to 82, 462.9 Mkwh during 1997-98.
However, T and D losses as a percentage of availability has declined
from 23 per cent in 1996-97 to 21.8 per cent in 1997-98.
- Highest T and D
losses have been recorded in Jammu and Kashmir during 1997-98 at 47
per cent. This is closely followed by Delhi, Haryana and Orissa.
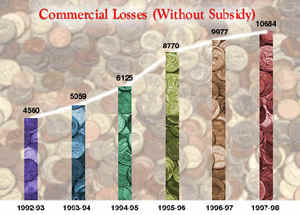
- The annual commercial
losses of the SEBs have increased consistently from Rs 4,560 crore in
1992-93 to Rs. 10, 684 crore in 1997-98.
- There has been
a gradual decline in the share of power sector in the total Plan outlay
since 1992-93. The share was 18.5 per cent in 1992-93 has declined to
13.4 per cent in 1996-97.
- In the Ninth Five
Year Plan (1997-2002), the outlay provided for power sector has declined
to 14.5 per cent of the total outlay from 18.33 per cent in eighth plan.
- As against this,
the share of power sector outlay for the Annual Plans 1997-98 and 1998-99
is 13.4 per cent and 13.85 per cent respectively.
- Over half a million
villages out of more than 0.6 million villages in India have been electrified
so far. In fact, thirteen states in the country have completed 100 per
cent village electrification.


